Posts Tagged ‘Industrial Revolution’
“The economic system is, in effect, a mere function of social organization”*…

The AI race is, of course, afoot. But while most headlines focus on the new capabilities and benchmarks achieved by competing developers, Jeremy Shapiro reminds us that the winners in this race won’t necessarily be the most objectively capable, but rather the players who most effectively integrate the technology into their organizations, economies, and societies…
Artificial intelligence has rapidly become a central arena of geopolitical competition. The United States government frames AI as a strategic asset on par with energy or defense and seeks to press its apparent lead in developing the technology. The European Union lags in platform power but seeks influence over AI through regulation, labor protections, and rule-setting. China is racing to catch up and to deploy AI at scale, combining heavy state investment with administrative control and surveillance.
Each of these rivals fears falling behind. Losing the AI race is widely understood to mean slower growth, military disadvantage, technological dependence, and diminished global influence. As a result, governments are pouring money into chips, data centers, and national AI champions, while tightening export controls and treating compute capacity as a strategic resource. But this familiar race narrative obscures a deeper danger. AI is not just another general-purpose technology. It is a force capable of reshaping the very meaning of work, income, and social status. The states that lose control of these social effects may find that technological leadership offers little geopolitical advantage.
History suggests that societies unable to absorb disruptive economic change become politically volatile, strategically erratic, and ultimately weaker competitors. The central question, then, is not only who builds the most powerful AI systems, but who can integrate them into society without triggering a societal backlash or an institutional breakdown.
Karl Polanyi’s The Great Transformation, published in 1944, explains why the capacity to “socially embed” new market forces determines national strength. By “embeddedness,” Polanyi meant that markets have historically been subordinate to social and political institutions, rather than governing them. The nineteenthcentury idea of what he called a “self-regulating market” was historically novel precisely because it sought to “disembed” the economy from society and organize social life around price and competition rather than social obligation. As Polanyi put it in his most succinct formulation, “instead of economy being embedded in social relations, social relations are embedded in the economic system.”
Writing in the shadow of the Great Depression, Polanyi argued that the attempt in the nineteenth century to create a self-regulating market society that treated labor, land, and money as commodities generated social dislocation so severe that it provoked authoritarian backlash and geopolitical collapse. Stable orders, he insisted, required markets to be re-embedded in social and political institutions. Where they were not, societies sought protection by other means, which often translated into support for fascist or communist regimes that promised to tame the market. Today, it often means electing populist leaders who promise to break the entire existing order, both domestic and international.
Polanyi insisted that the idea of a “self-adjusting market implied a stark utopia” because such a system could not exist “for any length of time without annihilating the human and natural substance of society.” The interwar gold standard, for example, disciplined states in the name of efficiency, but it did so by transmitting economic shocks directly into social life. When democratic governments proved unable to shield their populations, they either abandoned the liberal economic order or turned authoritarian (or both)…
[Shapiro considers the history of the 20th century, in particular the rise of Nazi Gernmany, sketches the state of play in the AI arena, considers the challenge of embedding the changes that AI will bring in The U.S., Europe, and China, then teases out the ways in which the “industrial revolution” is different from it predecessors (in particular, the mobility of capital, the services (as opposed to manufacturing)-heavy character of employment today, and the accelerating pace of tech deelopment. He concludes…]
… Geopolitical competition in the AI age will not take place solely in clean rooms or data centers. It will also involve the less visible realm of social institutions: labor markets, communities, social protections, and political legitimacy. Polanyi teaches us that markets are powerful only when societies can bear them. When they cannot, markets provoke their own undoing and often in rather spectacular fashion.
The West’s success in the Cold War owed much to its ability to reconcile capitalism with social protection. If the AI age is another “great transformation,” the same lesson applies. Chips matter. Data matters. But the ultimate source of power may be the capacity to re-embed technological change in society without sacrificing cohesion.
That is not a liberal-progressive distraction from geopolitical competition. It is its hidden core.
“The Next Great Transformation,” from @jyshapiro.bsky.social and @open-society.bsky.social.
For a complementary perspective (with special focus on the interaction between labor and the supply side of the economy) pair with: “Brave New World- a third industrial divide?” from @thunen.bsky.social in @phenomenalworld.bsky.social.
And see also: “AI and the Futures of Work,” from Johannes Kleske (@jkleske.bsky.social). A response to dramatic predictions of AI’s impact– most recently, Matt Shumer‘s viral “Something Big Is Happening“: it’s a possible future, Kleske suggests. but only one possibe future– and one that, while plausible, isn’t likely (at least outside the rarified atmsphere of coding, in which Shumer operates). In a way that echoes Shapiro’s piece above, Kleske suggests that individuals need to better understand the technology in order to retain/regain some agency, and societies need the same kind of rekindled resistance to act clearly and with purpose in re-embedding AI, and markets, in society. Not the other way around… Resonant with the thinking of Tim O’Reilly and Mike Loukides featured here before: “The best way to predict the future is to invent it“; and with Ted Chiang‘s “ChatGPT Is a Blurry JPEG of the Web” and “Will A.I. Become the New McKinsey?” And then there’s the ever-illuminating Rusty Foster (riffing on Gideon Lewis-Kraus‘ recent New Yorker piece): “A. I. Isn’t People.”
For a look at a high-value, trust-based use case for AI that seems to avoid the objections to AGI (and speak to Shapiro’s points), see “The Middle Game: Routers at the Edge,” from Byrne Hobart.
But back to AGI… as Nicholas Carr observes, we might understand Bosrtrom’s “paperclip maximizer” “not as a thought experiment but as a fable. It’s not really about AIs making paperclips. It’s about people making AIs. Look around. Are we not madly harvesting the world’s resources in a monomaniacal attempt to optimize artificial intelligence? Are we not trapped in an “AI maximizer” scenario?”
###
As we digest development, we might recall that it was on this date in 1962 that an early precondition for the revolution underway was first achieved: telephone and television signals were first relayed in space via the communications satellite Echo 1– basically a big metallic balloon that simply bounced radio signals off its surface. Simple, but effective.
Forty thousand pounds (18,144 kg) of air was required to inflate the sphere on the ground; so it was inflated in space. While in orbit it only required several pounds of gas to keep it inflated.
Fun fact: the Echo 1 was built for NASA by Gilmore Schjeldahl, a Minnesota inventor probably better remembered as the creator of the plastic-lined airsickness bag.

“If someone separated the art of counting and measuring and weighing from all the other arts, what was left of each (of the others) would be, so to speak, insignificant”*…

Mathematics, Bo Malmberg and Hannes Malmberg argue, was the cornerstone of the Industrial Revolution. A new paradigm of measurement and calculation, more than scientific discovery, built industry, modernity, and the world we inhabit today…
In school, you might have heard that the Industrial Revolution was preceded by the Scientific Revolution, when Newton uncovered the mechanical laws underlying motion and Galileo learned the true shape of the cosmos. Armed with this newfound knowledge and the scientific method, the inventors of the Industrial Revolution created machines – from watches to steam engines – that would change everything.
But was science really the key? Most of the significant inventions of the Industrial Revolution were not undergirded by a deep scientific understanding, and their inventors were not scientists.
The standard chronology ignores many of the important events of the previous 500 years. Widespread trade expanded throughout Europe. Artists began using linear perspective and mathematicians learned to use derivatives. Financiers started joint stock corporations and ships navigated the open seas. Fiscally powerful states were conducting warfare on a global scale.
There is an intellectual thread that runs through all of these advances: measurement and calculation. Geometric calculations led to breakthroughs in painting, astronomy, cartography, surveying, and physics. The introduction of mathematics in human affairs led to advancements in accounting, finance, fiscal affairs, demography, and economics – a kind of social mathematics. All reflect an underlying ‘calculating paradigm’ – the idea that measurement, calculation, and mathematics can be successfully applied to virtually every domain. This paradigm spread across Europe through education, which we can observe by the proliferation of mathematics textbooks and schools. It was this paradigm, more than science itself, that drove progress. It was this mathematical revolution that created modernity…
The fascinating story: “How mathematics built the modern world,” from @bomalmb and @HannesMalmberg1 in @WorksInProgMag.
* Plato
###
As we muse on measurement, we might recall that it was on this date in 1790, early in the French Revolution, that the French Assembly, acting on the urging of Bishop Charles Maurice de Talleyrand, moved to create a new system of weights and measures based on natural units– what we now know as the metric system.

“Another flaw in the human character is that everybody wants to build and nobody wants to do maintenance”*…
Hot, strenuous and unsung. As Steven Gonzalez Monserrate explains, there is nothing soft and fluffy about the caretaking work that enables our digital lives…
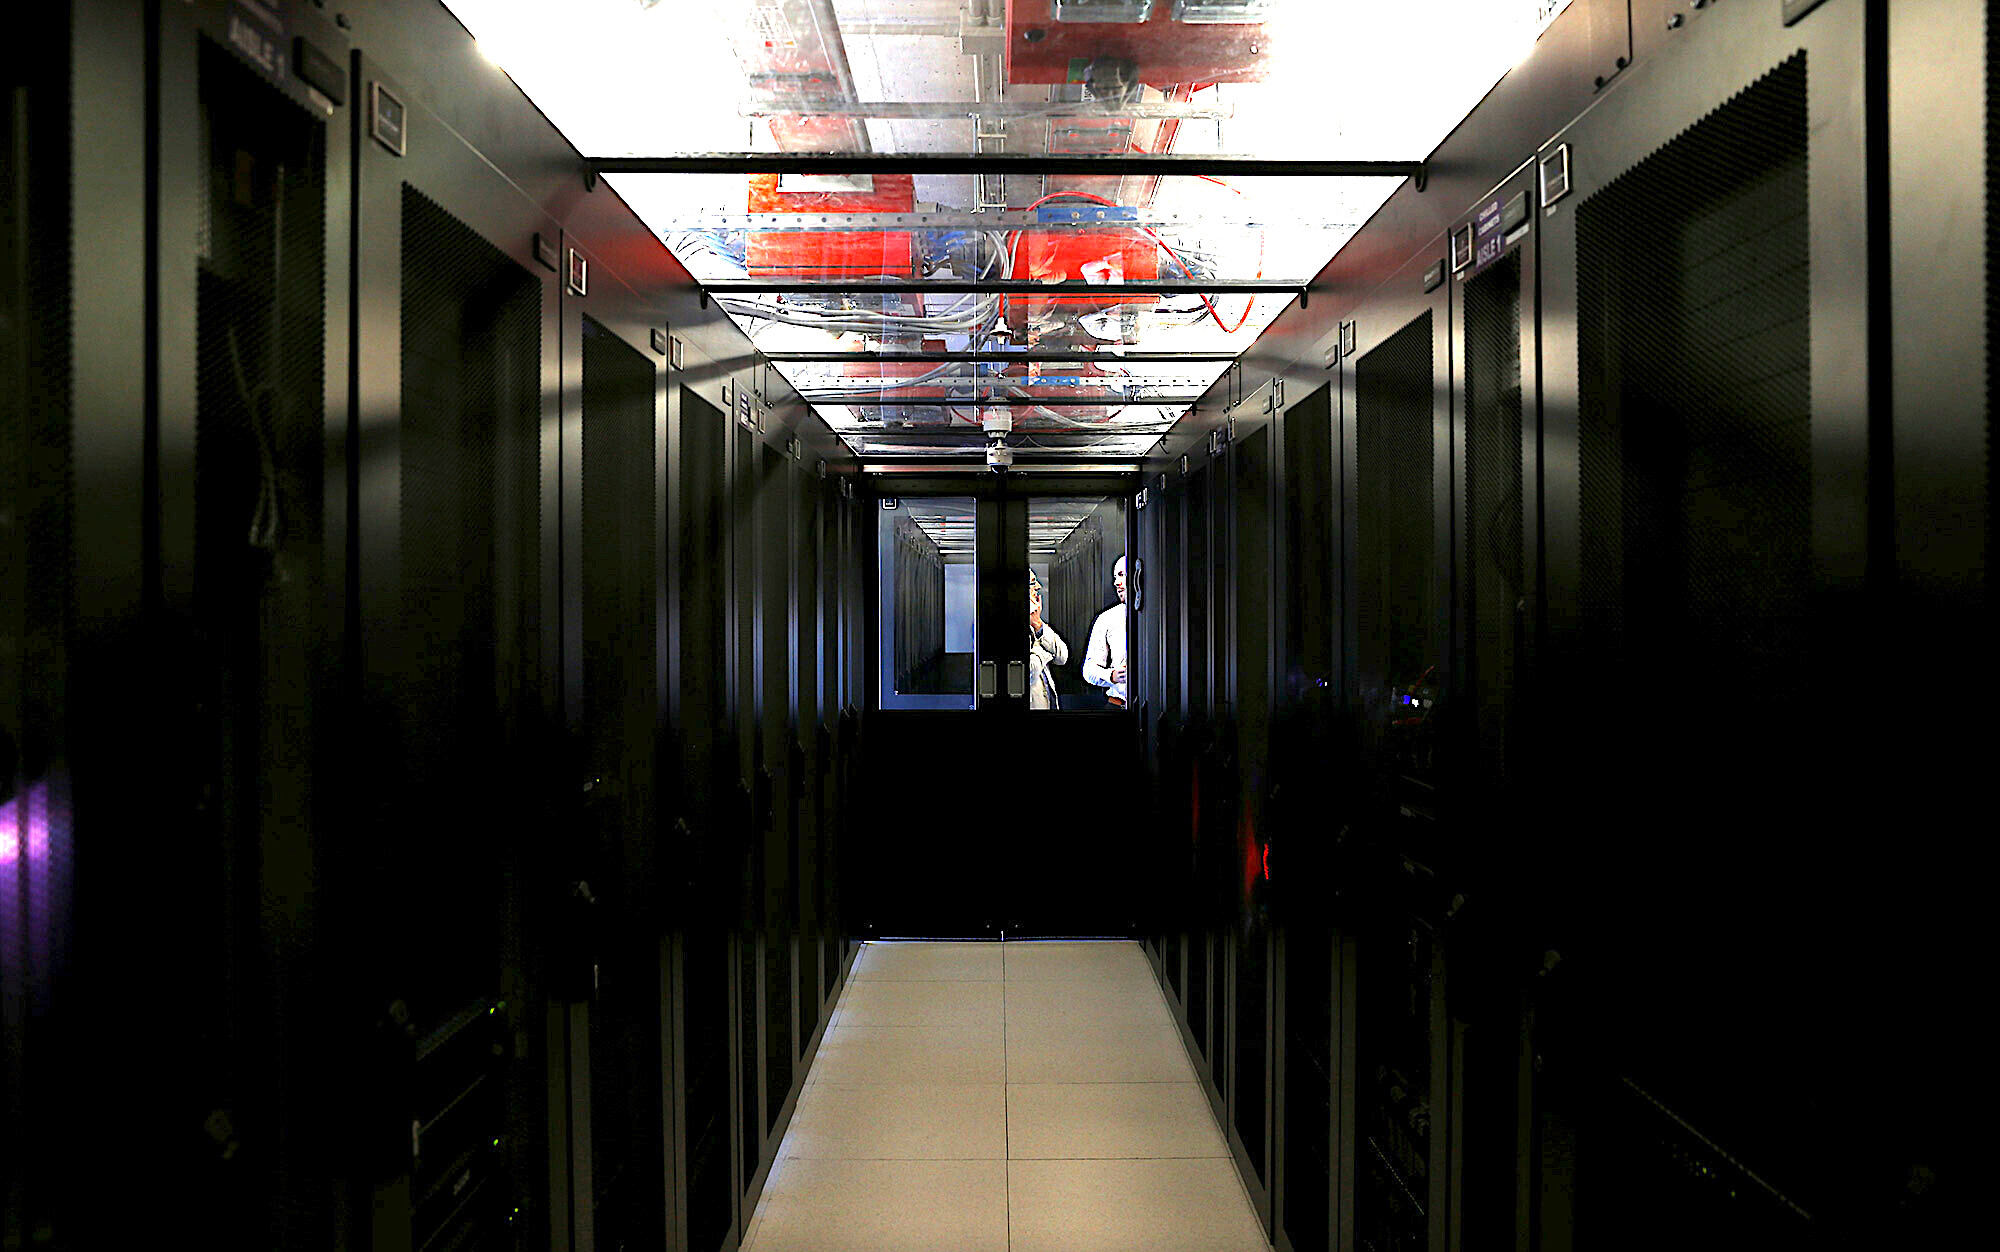
The ‘cloud’ is not an intangible monolith. It’s a messy, swelling tangle of data centres, fibre optic cables, cellular towers and networked devices that spans the globe. From the tropical megalopolis of Singapore to the remote Atacama Desert, or the glacial extremes of Antarctica, the material infrastructure of the cloud is becoming ubiquitous and expanding as more users come online and the digital divide closes. Much has been written about the ecological impact of the cloud’s ongoing expansion: its titanic electricity requirements, the staggering water footprint required to cool its equipment, the metric tonnes of electronic waste it proliferates, and the noise pollution emitted by the diesel generators, churning servers and cooling systems required to keep data centres – the heart of the cloud – operational 24 hours a day, seven days a week, 365 days a year.
But less has been written about those who work inside the machinery of the cloud. Though often forgotten, this community of technicians, engineers and executives is integral to the functioning of our increasingly digitised society. They are the caretakers of the digital, the wardens of our data, and the unsung heroes working tirelessly to sustain an ever-expanding array of digital objects, including our emails, cat videos, maps, non-fungible tokens, metaverse avatars, digital twins and more. The idea of digital caretakers might conjure science fiction images of empty, towering warehouses stacked with racks of automated machines. But these workers are very much flesh and blood. The silicon milieu they’re part of is as human as it is mechanical. From their vantage, the cloud is not merely an infrastructure they maintain, but a way of life, an identity, a culture of stewardship – replete with its own norms, rituals and language…
Explore that fascinating culture: “The people of the cloud,” from @cloudAnthro in @aeonmag.
Apposite: “The Maintenance Race,” from Stewart Brand (@stewartbrand)
* Kurt Vonnegut
###
As we contemplate continuity, we might spare a thought for Richard Arkwright; he died on this date in 1792. An inventor and entrepreneur, he was a leader in the early stage of the Industrial Revolution. Arkwright was the driving force behind the development of the spinning frame, known as the water frame after it was adapted to use water power; he patented a rotary carding engine to convert raw cotton to ‘cotton lap’ prior to spinning; and he was the first to develop factories housing both mechanized carding and spinning operations, combining power, machinery, semi-skilled labor and the (then-new to England) raw material of cotton to create mass-produced yarn. Indeed, His organizational skills earned him the honorific title “father of the modern industrial factory system.”

“Almost everybody today believes that nothing in economic history has ever moved as fast as, or had a greater impact than, the Information Revolution. But the Industrial Revolution moved at least as fast in the same time span, and had probably an equal impact if not a greater one.”*…

Dylan Matthews talks with Jared Rubin and Mark Koyama, the authors of an ambitious new economic history…
You can crudely tell the story of our species in three stages. In the first, which lasted for the vast majority of our time on Earth, from the emergence of Homo sapiens over 300,000 years ago to about 12,000 years ago, humans lived largely nomadic lifestyles, subsisting through hunting and foraging for food. In the second, lasting from about 10,000 BC to around 1750 AD, humans adopted agriculture, allowing for a more secure supply of food and leading to the establishment of towns, cities, even empires.
The third period, in which we all live, is characterized by an unprecedented phenomenon: sustained economic growth. Quality of life went from improving very gradually if at all for the vast majority of human history to improving very, very quickly. In the United Kingdom, whose Industrial Revolution kicked off this transformation, GDP per capita grew about 40 percent between 1700 and 1800. It more than doubled between 1800 and 1900. And between 1900 and 2000, it grew more than fourfold.
What today we’d characterize as extreme poverty was until a few centuries ago the condition of almost every human on Earth. In 1820, some 94 percent of humans lived on less than $2 a day. Over the next two centuries, extreme poverty fell dramatically; in 2018, the World Bank estimated that 8.6 percent of people lived on less than $1.90 a day. And the gains were not solely economic. Before 1800, average lifespans didn’t exceed 40 years anywhere in the world. Today, the average human life expectancy is more like 73. Deaths in childhood have plunged, and adult heights have surged as malnutrition decreased.
The big question is what drove this transformation. Historians, economists, and anthropologists have proposed a long list of explanations for why human life suddenly changed starting in 18th-century England, from geographic effects to forms of government to intellectual property rules to fluctuations in average wages.
For a long time, there was no one book that could explain, compare, and evaluate these theories for non-experts. That’s changed: How the World Became Rich, by Chapman University’s Jared Rubin and George Mason University’s Mark Koyama, provides a comprehensive look at what, exactly, changed when sustained economic growth began, what factors help explain its beginning, and which theories do the best job of making sense of the new stage of life that humans have been experiencing for a couple brief centuries…
Two economic historians explain what made the Industrial Revolution, and modern life, possible: “About 200 years ago, the world started getting rich. Why?,” from @dylanmatt @jaredcrubin @MarkKoyama in @voxdotcom.
* Peter Drucker
###
As we contemplate change and its causes, we might spare a thought for Charles Francis Jenkins; he died on this date in 1934. An engineer and inventor, he is rightly remembered for his contributions to film and television: he invented a film projector and sold the rights to Thomas Edison, who marketed it as the Vitascope, the projector that Edison used in paid, public screenings in vaudeville theaters; and he opened the first television broadcasting station in the U.S. (W3XK in Washington, D.C.).
But Jenkins also pioneered in other areas. He was the first to move an automobile engine from under the seat to the front of the car; he invented the automotive self starter (replacing the crank) and an improved altimeter for aviation; and he created the cone-shaped drinking cup.

“When the graphs were finished, the relations were obvious at once”*…

We can only understand what we can “see”…
… this long-forgotten, hand-drawn infographic from the 1840s… known as a “life table,” was created by William Farr, a doctor and statistician who, for most of the Victorian era, oversaw the collection of public health statistics in England and Wales… it’s a triptych documenting the death rates by age in three key population groups: metropolitan London, industrial Liverpool, and rural Surrey.
With these visualizations, Farr was making a definitive contribution to an urgent debate from the period: were these new industrial cities causing people to die at a higher rate? In some ways, with hindsight, you can think of this as one of the most crucial questions for the entire world at that moment. The Victorians didn’t realize it at the time, but the globe was about to go from less than five percent of its population living in cities to more than fifty percent in just about a century and a half. If these new cities were going to be killing machines, we probably needed to figure that out.
It’s hard to imagine just how confusing it was to live through the transition to industrial urbanism as it was happening for the first time. Nobody really had a full handle on the magnitude of the shift and its vast unintended consequences. This was particularly true of public health. There was an intuitive feeling that people were dying at higher rates than they had in the countryside, but it was very hard even for the experts to determine the magnitude of the threat. Everyone was living under the spell of anecdote and availability bias. Seeing the situation from the birds-eye view of public health data was almost impossible…
The images Farr created told a terrifying and unequivocal story: density kills. In Surrey, the increase of mortality after birth is a gentle slope upward, a dune rising out of the waterline. The spike in Liverpool, by comparison, looks more like the cliffs of Dover. That steep ascent condensed thousands of individual tragedies into one vivid and scandalous image: in industrial Liverpool, more than half of all children born were dead before their fifteenth birthday.
The mean age of death was just as shocking: the countryfolk were enjoying life expectancies close to fifty, likely making them some of the longest-lived people on the planet in 1840. The national average was forty-one. London was thirty-five. But Liverpool—a city that had undergone staggering explosions in population density, thanks to industrialization—was the true shocker. The average Liverpudlian died at the age of twenty-five, one of the lowest life expectancies ever recorded in that large a human population.
There’s a natural inclination to think about innovation in human health as a procession of material objects: vaccines, antibiotics, pacemakers. But Farr’s life tables are a reminder that new ways of perceiving the problems we face, new ways of seeing the underlying data, are the foundations on which we build those other, more tangible interventions. Today cities reliably see life expectancies higher than rural areas—a development that would have seemed miraculous to William Farr, tabulating the data in the early 1840s. In a real sense, Farr laid the groundwork for that historic reversal: you couldn’t start to tackle the problem of how to make industrial cities safer until you had first determined that the threat was real.
Why the most important health innovations sometimes come from new ways of seeing: “The Obscure Hand-Drawn Infographic That Changed The Way We Think About Cities,” from Steven Johnson (@stevenbjohnson). More in his book, Extra Life, and in episode 3 of the PBS series based on it.
###
As we investigate infographics, we might send carefully calculated birthday greetings to Lewis Fry Richardson; he was born on this date in 1881. A mathematician, physicist, and psychologist, he is best remembered for pioneering the modern mathematical techniques of weather forecasting. Richardson’s interest in weather led him to propose a scheme for forecasting using differential equations, the method used today, though when he published Weather Prediction by Numerical Process in 1922, suitably fast computing was unavailable. Indeed, his proof-of-concept– a retrospective “forecast” of the weather on May 20, 1910– took three months to complete by hand. (in fairness, Richardson did the analysis in his free time while serving as an ambulance driver in World War I.) With the advent of modern computing in the 1950’s, his ideas took hold. Still the ENIAC (the first real modern computer) took 24 hours to compute a daily forecast. But as computing got speedier, forecasting became more practical.
Richardson also yoked his forecasting techniques to his pacifist principles, developing a method of “predicting” war. He is considered (with folks like Quincy Wright and Kenneth Boulding) a father of the scientific analysis of conflict.
And Richardson helped lay the foundations for other fields and innovations: his work on coastlines and borders was influential on Mandelbrot’s development of fractal geometry; and his method for the detection of icebergs anticipated the development of sonar.

You must be logged in to post a comment.