Posts Tagged ‘shipping’
“The real danger is assuming that because you haven’t had a problem yet, you won’t have one soon”*…

Joan Didion once observed that “survivors look back and see omens, messages they missed.” That’s certainly true in investment arena… where stock indices have been hovering near all time highs while everyone awaits the falling of the shoe(s) from Trump’s tariffs and assorted other blows to the economy. Will we look back in the not-too-distant future to signs that it couldn’t, thus wouldn’t, continue?
Omens registered in advance are “early warning signs.” A classic on the economic front is the “cardboard box index“; the output of cardboard boxes is believed to be an indicator of future production of consumer goods, since cardboard containers are so common for packaging and shipping these goods. It’s down.
Mike Schuler, the managing editor of gCaptain weighs in with another…
The U.S. container shipping industry is heading toward what could be one of the most significant volume declines in its six-decade history, according to the latest analysis from shipping expert John McCown.
August data revealed only a slight 0.1% year-over-year increase in inbound container volume at the ten largest U.S. ports, following a temporary reprieve in July when volumes rose 3.2%. Meanwhile, outbound volume in August dropped 2.6%, continuing an erratic pattern that saw a 2.0% increase in July and a 1.7% decrease in June.
The marginal growth in August inbound volumes can be attributed to an exception for goods in transit after the August 7 implementation of revised reciprocal tariffs. “The new tariffs did not apply to containers that were loaded on vessels at their last foreign port of call before August 7 provided they entered the U.S. before October 5,” McCown explains.
This exemption artificially supported August figures, as “the large majority of boxes coming into the U.S. in August being exempt from the tariffs going into effect on August 7.” McCown adds that this mechanism may have even incentivized strategic deployment adjustments where “ships were loaded by August 7 and slow-steamed to the U.S.”
A stark contrast is emerging between U.S. container volumes and global shipping trends. “When U.S. container volume data is compared to global data and data in other major areas, there is a noticeable and widening gap as the downtrends in U.S. lanes are being significantly mitigated by increased volume in other areas,” notes McCown.
Evidence of this divergence can be seen in Far East export figures, which “set a new record and were 6.3% ahead of the same month last year” in July. McCown observes that “world container supply chains have already begun to adapt and reconfigure trading patterns. The U.S. is a less relevant player in world trade today than it was prior to these various tariff initiatives and will become more so as announced plans are implemented.”
The National Retail Federation has revised its projection for 2025, now expecting total inbound volume to decrease by 3.4%. When considering that year-to-date volume through August shows a 3.1% increase, this projection translates to “the remaining four months of 2025 being down 15.7% compared to the same four months in 2024.”
September will likely mark the beginning of more pronounced declines. In a September 17 presentation, the Port of Los Angeles director stated they expected inbound volume to drop 10% compared to the same month last year. Container bookings data supports this outlook, with bookings from China to the U.S. down 26% in the first week of September compared to the same period last year.
The situation could worsen if currently paused reciprocal tariffs on Chinese imports are implemented in mid-November. “If and when those tariffs are implemented, it is highly likely that they would lead to broader declines related to inbound containers to the U.S. from China,” McCown warns.
Adding another layer of complexity is the upcoming USTR ship fee plan targeting ships built in China or operated by Chinese carriers, set to take effect in mid-October. McCown describes this as “moving container volume related to trade lanes involving the U.S. into unchartered waters.” As these lanes account for more than a quarter of global container miles, “there will be a ripple effect that will be felt globally.”
The projected decline represents an unprecedented shift for an industry that has historically grown at rates exceeding U.S. GDP. “For a tangible metric that has consistently for decades grown above U.S GDP, most often at two, three or even more multiples of GDP, the unusual nature of an actual decline in inbound container volume into the U.S. cannot be overemphasized,” McCown states.
While the immediate volume impact is becoming clearer, the inflationary effects of the tariffs will take longer to manifest fully in economic data. McCown notes that “it will not be until at least when the inflation data is released in during the fourth quarter that the inflationary impact of the tariffs can begin to be accurately assessed.”
McCown concludes that the U.S. faces a difficult trade-off: “The more inbound container volume to the U.S. declines, the more commerce and growth will be impacted but the less inflation we will get. The less inbound container volume to the U.S. declines, the more inflation we will get but the less commerce and growth will be impacted. Unfortunately, there is simply no good place to be on that spectrum.”…
For what it’s worth, your correspondent does not share McCown’s confidence that a drop in container volume– in imported goods– will not raise prices. While the goods that don’t arrive won’t be passed along with tariffs baked into their prices, their substitutes, which will, per force, be scare for some time, seem likely to have their prices “bid” up…
“U.S. Container Imports Face Historic Decline as Tariff Effects Take Hold.”
All this said, prediction on the basis of indicators (and omens and signs and early warning signals and the like) is a tricky business. See, for example: “List of dates predicted for apocalyptic events.”
* G. Scott Graham, Early Warning Signals
###
As we batten down, we might recall that it was on this date in 2008 that U.S. stock markets, already on edge after the near failure of Wachovia Bank the day before, fell over the edge after the House rejected a bailout plan touted to help ease the ongoing financial crisis. Markets began their decline as soon as it became apparent the bill would fail. The Dow had its worst single day point decline in history, falling 777.68 points… the day that “The Crash of 2008” became real.

“This is a cardboard universe”*…

As we rid ourselves of the detritus of the Holiday season, let us pause to consider its signature component: at the turn of the 21st century, corrugated cardboard accounted for just fifteen percent of the United States recycling stream; today, it’s nearly half. Shannon Mattern on the cardboard box…
… As historian Maria Rentetzi writes (“Cardboard Box: The Politics of Materiality,” in Boxes: A Field Guide), “the cardboard box — the waste of our commercial world — is recycled in such a way as to make visible the disorder in our societies, the faults of capitalism.” It is an abject object that touches all parts of the city, from the granite kitchen island to the sewer grate. And for many of us, the cardboard box is our closest touchpoint to globalized trade, structuring our relations with people in distant places. It brings the logistics chain to our doorstep. The magnificently ripped metal freight container may get the Economist cover shot, but the plain brown box delivers messages to our homes. Its very existence in our homes, Marshall McLuhan would say, is the message. In the immortal words of Walter Paepcke, founder of the Container Corporation of America, “packages are not just commodities; they are communications.”
Let’s unpack that, shall we? Boxes are media in multiple senses of the word. They’re lithographed surfaces designed to be read, and they’re dimensional containers that mediate between outside and inside worlds. They’re “media of transport and information, shapers of public opinion and consumer desire, and means of targeting attention.” And they’re “logistical media” that “arrange people and property into time and space,” that “coordinate and control the movement of labor, people, and things situated along and within global supply chains.” The cardboard box is a minimalist form with maximalist ambitions, an arboreal apparatus made from one of the world’s most abundant renewable resources, then filled with plastic and moved around by copious quantities of oil. It doesn’t just coordinate and control landscapes; it transforms them.
Cardboard’s ubiquity rests on simple claims: I can hold that, and I can go there. The Container Corporation of America was founded in 1926, and upon those claims it built an empire with surprising reach. The CCA made collapsible shipping boxes, and it transformed packaging into a science and an art. It advanced market research, shaped mid-century taste, and altered the chromatic universe through color standards. It employed some of the best graphic designers of the period, and as national borders shifted after the Second World War, it commissioned Herbert Bayer, author of the Universal typeface, to revise the World Geo-Graphic Atlas. Even then, the CCA was remaking that new world to meet its logistical needs, rehabbing mining towns and germinating forests, and orchestrating civic discourse about all of this.
How did a packaging company get into the publishing business — into the containment and distribution of information? How were geographic imaginations changed in the process? Soon we’ll dive into the Paepcke archive, to find answers to those questions. But first I want to show you how a cardboard box is made…
In turn, inspiring and horrifying– the social history of the cardboard carton: “World in a Box,” @shannonmattern.bsky.social in @placesjournal.bsky.social.
For an earlier (R)D focused on Mattern’s work: “To clarify, ADD data.”
* Philip K. Dick, The Dark-Haired Girl
###
As we tape it tight, we might recall that it was on this date in 1910 that a federal official who might slowed the onset of the cardboard box was fired: Gifford Pinchot, the first chief of the United States Forest Service, was fired by President William Howard Taft. Pinchot had opposed Taft’s newly appointed Secretary of the Interior, Richard Ballinger, who favored commercial exploitation of federal reserve lands.
During President Theodore Roosevelt’s term, Pinchot had help enable policies for the conservation of natural resources. Roosevelt had designated millions of acres to protect as National Forests. That legacy was threatened, so Pinchot pressured Taft to remove Ballinger from office. In November of 1909, Collier’s Magazine had created a scandal when it accused Ballinger of shady dealings in coal lands in Alaska. When Pinchot criticized both Ballinger and Taft, the president reacted by firing him.

“Curiosity has its own reason for existing”*…

Brian Klaas on how it is we know where we are– a riff from his recent book, Fluke: Chance, Chaos, and Why Everything We Do Matters that covers everything from navigational neurons to the calculation of longitude (with helpful updates to Dava Sobel’s estimable account)– and on how that history demonstrates the importance of curiosity…
We now navigate the world with ease, our location pinpointed by satellites floating high above us in the heavens, but it was not always so. How have our brains evolved to explore a complex landscape? And how did an 18th century government harness the dreams of crackpots and obsessive craftsmen to solve one of the most important questions of them all: where am I? The answer lies with an extraordinary story, linking neurons with naval history…
[Klass illustrates the cost of bad navigation [naval disasters], explains how animals [including humans] use “magnetic maps to navigate by a kind of dead reckoning], and unpacks the many obstacles to determining longitude at sea [mainly that it depended on very accurate time-keeping, a problem at sea with current clocks. The British Parliament offered a monumental cash prize for solving the conundrum, but there were no winners… until John Harrison came along…]
… John Harrison changed everything.
Harrison had little formal education, but was masterful working with wood and was fascinated by clocks. At first, he had difficulty convincing the scientific establishment of his ideas, but soon, his clocks dazzled. He refined them over decades—in one case spending seventeen years working on a single clock—producing five timepieces, the first working marine chronometers. Little by little, they improved, making it plain that scientific impossibility was becoming reality, forged through the determination and inventiveness of a self-taught craftsmen with a laudable obsession with problem-solving and timekeeping.
Harrision came up with several innovations that changed not just marine history, but world history. His clocks solved the problem of oil by designing it away; his timepieces—seemingly miraculously—employed several new anti-friction devices, facilitated by, among other innovations, using a naturally oily wood. Then, taking his genius one step further, Harrison invented the caged roller bearing, a nearly frictionless mechanism that later helped unleash the industrial revolution by improving machinery. Caged roller bearings are still used in “virtually every complex machine made today.”
To solve the problem of pendulums that elongate or shrink in varied climates, Harrison invented a bimetallic mechanism of canceling these expansions and contractions out. By combining brass and steel, he could effectively ensure that any bit of the mechanism that elongated would be offset as “the downward expansion of the steel rods is counteracted by the upward expansion of the brass rods.” Harrison’s related invention of the bimetallic strip is still used today and has been instrumental in thermometers, gas safety valves in ovens, electric circuit breakers, and cars, to name a few…
…
… For centuries, Harrison’s innovations changed history, and revolutionized navigation on the seas. That only changed in the early 20th century, when the wireless telegraph and radio signals made it possible to transmit time signals across vast distances to shipboard receivers. Finally, GPS—using satellites—eclipsed methods that relied on earthbound timekeeping.
But the tale of longitude—and the ongoing scientific sleuthing into the neurons we use to navigate across shorter distances—yield three important lessons.
First, government prizes can act as a crucial catalyst for scientific innovation. The industrial revolution and the rise of British naval superiority were both partially unleashed due to an investment of just two million pounds in today’s value [the prize offered by Parlaiment]. We should be developing many more state-funded scientific prizes today, particularly for research into neuroscience, as the 21st century will likely be defined by our understanding of complex cognition, both artificial and human.
Second, scientific snobbery—and excluding people from innovation based on credentialism—could have kept Harrison’s ideas from emerging, delaying crucial progress. It’s a cautionary tale for the modern world, in which our degrees are often wrongly imagined as an accurate shorthand for our intellectual worth.
Finally, the tale of longitude highlights the intellectual incuriosity of our modern age, in which we, to an unprecedented degree, drift through the world while rarely pausing to ask “how does that work?” We happily tap our destination into Google Maps, never wondering how the solution to what is now such a banal task as navigation changed the fate of the world forever.
In one wonderful psychology study, participants were asked if they knew how a toilet worked. “Of course!” the participants replied. “Great!” said the scientists. “Please write down, or draw, how it works.”
At that point, the participants realized they had no idea how a toilet works much beyond how to make it flush. As
Adam Mastroianni highlights: “This isn’t specific to toilets—you can get it with everything from spray bottles to helicopters.” This is known as the “illusion of explanatory depth,” where we imagine that we understand something, but are completely flummoxed when we’re asked how it actually works. Gravity is another great example. (Try explaining, in detail, exactly why stuff falls down, other than saying that masses exert forces on each other. Sure, but how?).
The point, then, is that human problems are often best solved by diverse—but stubborn thinkers—who are insatiably curious and relentlessly ask two simple questions that we mostly take for granted: “Why?” and “How?”
Countless lives were saved and the trajectory of world history shifted across centuries, all because one clockmaker couldn’t get those questions out of his head…
On the abiding importance of curiosity: “The Thrilling Tale of Longitude and Our Neurons of Navigation,” from @brianklaas.
* Albert Einstein
###
As we find our place, we might recall that this date in 1896 is important to the technology that ultimately replaced the chronometer in navigation: it was the day that Guglielmo Marconi applied for British Patent number 12039 regarding a system of telegraphy using Hertzian waves. We call it radio.

“Conceal me what I am, and be my aid for such disguise as haply shall become the form of my intent”*…
Jurisdictional triage…
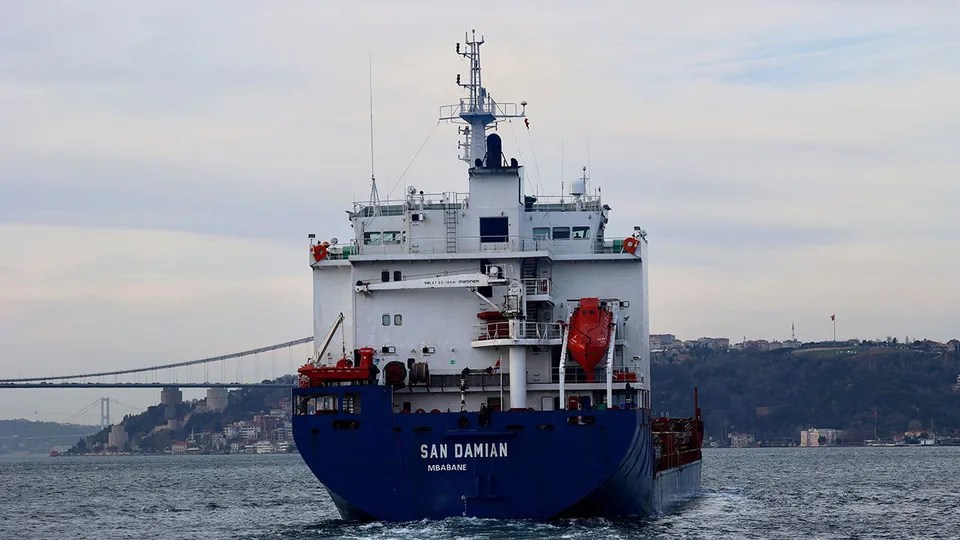
The website for the shipping registry of Eswatini (formerly Swaziland), established in October 2023, appears much like those of more established seafaring nations. A picture of vast cruise ships sits alongside promises of the “highest quality ship maritime services and ship registrations”. Delve deeper though and Eswatini’s nautical credentials start to unravel. For one thing, the African country is landlocked, calling into doubt the assertion that the port of Mbabane, Eswatini’s capital, is situated on the coast of South Africa. It is a “dry port”, 150km from the sea and 30km from a rail link to Maputo on Mozambique’s Indian Ocean coast. Its stated ability to handle “containers, bulk carriers and tankers” seems questionable.
The country is following in the wake of other smaller nations that offer their flag to shipowners. Seagoing vessels are obliged by maritime law to fly a flag of a country of registration and stateless vessels are not protected by international law. Yet the days when the stern of a ship would fly a national flag connected to the ownership of the vessel are long past. Liberia, Panama and the Marshall Islands now account for nearly half of the global fleet, by tonnage. Countries with loose ties to seafaring have been dubbed “flags of convenience” for levying low or no taxes and offering an escape from burdensome labour laws and other regulatory requirements. Often administered by private companies based elsewhere, these registries are a handy source of additional revenue for small and poor countries.
Registering a merchant vessel with a jurisdiction that is a mere speck on the map is not necessarily a cause for concern. Many take seriously their responsibility to oversee adherence to the rules and regulations of the high seas. Liberia’s, based near Washington, dc, has a good record of maintaining global standards across its fleet. Other registries merely give a “façade of legal oversight” says Richard Meade, editor of Lloyd’s List Intelligence, a trade publication. A blacklist complied by Paris mou, an organisation that aims to “eliminate the operation of substandard ships”, puts the likes of Cameroon, Vanuatu and Comoros near the bottom…
…
Less diligent registries are helping to fuel the growth of a “dark fleet”—some 1,400 vessels, according to the Atlantic Council, a think-tank—that operates with little regulatory oversight. They are mostly oil tankers that engage in subterfuge to hide where they are and the origin of their cargo in order to evade sanctions on Russian crude oil. Ownership is often opaque. Mr Meade estimates that 12% of the global tanker fleet is now dark. He notes that Gabon’s registry, now comprising 140 vessels, is the fastest-growing in the world thanks largely to the reflagging of Russian tankers.
An expanding dark fleet poses a danger to itself and other vessels. Dark ships tend to be old and less well maintained, and some may be uninsured. Practices such as turning off or “spoofing” location devices are a danger to other ships. Swapping oil cargoes at sea to obscure their origins poses the danger of a spillage. Mr Meade foresees a worse calamity of a large “dark fleet” tanker sinking in an environmentally sensitive area, with no accountability…
Sea-going chicanery: “Why does landlocked Eswatini have a ship registry?” (gift article) from @TheEconomist.
* Shakespeare, Twelfth Night
###
As we deconstruct disguises, we might recall that it was on this date in 1617 that Sweden and the Tsardom of Russia signed the Treaty of Stolbovo, ending the Ingrian War and shutting Russia out of the Baltic Sea… until 1703, when Peter the Great won back access in battle with the Swedes– a victory he cemented by founding St. Petersburg.


“As people who deal with the ocean you must see the irony. We are facing a shortage on a planet whose surface is covered two-thirds with water.”*…

The Panama Canal has become a vital link in the web of global trade, especially that trade that connects Asia and the U.S. U.S. commodity export and import containers account for 73% of Panama Canal traffic, representing about $270 billion in cargo. That trade is now constrained, as water shortage has reduced the Canal’s throughput…
For months, the global shipping community has been closely watching the Panama Canal, as a severe drought has threatened water levels and forced the Panama Canal Authority to enact restrictions on the maximum weight and size of vessels that can transit its waters. The impact of the Panama Canal Authority’s restrictions has been negligible, as lower shipping demand offset any vessel weight restrictions–until now…
It takes almost 200 million gallons of water for every ship to transit the Panama Canal. And, in a drought, that’s become a problem. The Panama Canal operates with a lock system that is fed via freshwater drawn from Lake Gatun. The water flows from the lake, the high point of the canal, down through the lock system and is then discharged to sea. While the canal’s newer locks can recycle about 60% of its water, it still requires a tremendous amount of water for every ship to pass through.
At this time of year, the lake’s average water level should be around 87 feet, but the lake currently sits at 81.8 feet and is forecasted to remain at or near that level through January. To make matters worse, the lake is only receiving 70% of the intake it needs (largely from rain) to satisfy the canal’s water usage.
To combat this, about a year ago the Panama Canal Authority began limiting the draft of vessels (the distance between the waterline and the deepest point of the boat) that are using the canal. The current draft limit is 44 feet (from a normal 50 feet). A lot of factors influence the draft of a vessel but the number one factor which can be controlled most readily is the vessel’s weight. For every one foot of draft reduction, a container ship has to reduce its weight by the equivalent of 300-400 TEU (at 14 tonnes of cargo). Therefore a six-foot reduction in draft equates to 1800-2400 TEU of reduction in vessel capacity.
As the reduction in vessel draft proved to not be enough to manage Lake Gatun water levels, the Canal Authority began to limit the daily transits of vessels. The canal normally sees 34 planned transits per day. This has been reduced to 24 transits and is forecast to reduce to 18 by February 1, 2024…
“What You Need To Know About the Impact of the Panama Canal on Global Logistics”
Consequently, shipping companies are faced with a thorny choice: They can risk waiting for days, pay a big fee to jump the line (currently running at $4-4.5 million per passage), or avoid the canal entirely by taking a longer route… any of which increase the cost of transit– a cost that likely to show up in prices…
… Shipping companies are set to incur heavy losses due to the bottleneck. Maersk, which is the second-largest shipping company in the world, said it was working to ensure the backlog did not disrupt its deliveries. “We follow the guidance from the Panama Canal and adapt our intake on relevant services in advance of the departure at origin. Maersk remains committed to minimizing disruptions to our operations,” it said in a press release. The Danish company moves more than four million TEU (Twenty Foot Equivalent Unit) vessels every year. In 2021, it saw its revenues reach $62 billion. Maersk added that the low water levels in the Panama Canal were a stark reminder of the climate crisis, and its ripple effect on global supply chains.
There is still no estimate of how much the Panama Canal jam will cost shipping companies, but the situation is a reminder of the 2021 crisis in the Suez Canal in Egypt. In that case, shipping companies suffered multi-billion dollar losses when the Ever Given container ship got stuck and blocked access to the canal…
“The economic impact of the Panama Canal jam: Inflation and shipping losses“
Capacity is down; time-to-market is up; and costs are rising: The Panama Canal is under environmental pressure.
See also: “Drought Saps the Panama Canal, Disrupting Global Trade” (gift article).
* Clive Cussler, Blue Gold
###
As we deal with drought, we might recall that it was on this date in 1982 that a soil sample taken in Times Beach, Missouri, was found to contain 300 times the safe level of dioxin (c.f. Agent Orange). A byproduct of the manufacture of hexachlorophene (banned in 1972) by NEPACCO (the North Eastern Pharmaceuticals and Chemicals Company), the dioxin was meant to be stored securely onsite, but was eventually improperly disposed of in a trench in the facility, and by a local waste handler.
Times Beach– well over 2,000 residents– was completely evacuated and relocated early in 1983. The land that was once Times Beach is now Route 66 State Park. One building from the town still exists: the park’s visitor center was once a roadhouse from Times Beach’s glory days and was the EPA’s headquarters for the area.

You must be logged in to post a comment.