Posts Tagged ‘inflation’
“You get what you measure”*…

Matt Stoller takes the occasion of Trump’s selection of Kevin Warsh to head the Fed (“an orthodox Wall Street GOP pick, though he is married to the billionaire heiress of the Estee Lauder fortune and was named in the Epstein files. He’s perceived not as a Trump loyalist but as an avatar of capital”) to ponder why public satisfaction with the economy is so low (“if you judge solely by consumer sentiment, Trump’s first term was the third best economy Americans experienced since 1960. Trump’s second term is not only worse than his first, it is the worst economic management ever recorded by this indicator”).
Stoller argues that we’re mesuring the wrong things (or, in some cases, the right things in the wrong ways)…
… the models underpinning how policymakers think about the economy just don’t reflect the realities of modern commerce. The fundamental dynamic is that those models were constructed in an era where America was one discrete economy, with Wall Street and the public tied together by the housing finance system. But today, Americans increasingly live in tiered bubbles that have less and less to do with one another. Warsh will essentially be looking at the wrong indicators, pushing buttons that are mislabeled.
While corporate America is experiencing good times, much of the country is experiencing recessionary conditions. Let’s contrast consumer sentiment indicators with statistics showing an economic boom. Last week, the government came out with stats on real gross domestic product increasing at a scorching 4.4% in the third quarter of last year. There’s higher consumer spending, corporate investment, government spending, and a better trade balance. Inflation, according to the Consumer Price Index, is low at 2.6.% over the past year. And while official numbers aren’t out for the final three months of the year, the Atlanta Fed’s GDPNow forecast shows that it estimates growth at 4.2%. And there are other indicators showing prosperity, from low unemployment to high business formation, which was up about 8% last year, as well as record corporate profits…
… Behavioral economists and psychologists have all sorts of reasons to explain that people don’t really understand the economy particularly well. But in general, when the stats and the public mood conflict, I believe the public is usually correct. Often, there are some weird anomalies with the data used by policymakers. In 2023, I noticed that the consumer price index, the typical measure of inflation, didn’t account for borrowing costs, so the Fed hike cycle, which caused increases in credit card, mortgage, auto loan, payday loans, et al, just wasn’t incorporated. The public wasn’t mad at phantom inflation, they were mad at real inflation that the “experts” didn’t see.
I don’t think that’s the only miscalculation…
[Stoller goes on to explain the ways in which “consumer spending” doesn’t tell us much about consumers anymore, about the painful reality of “spending inequality,” and about the obscure(d) problem of monopoly-driven inflation. He concludes…]
… Finally, there’s a more philosophical point, which I don’t think explains the short-term frustrations people feel, but is directionally correct. Do people actually want what the economy is producing? For most of the 20th century, the answer was yes. When Simon Kuznets invented these measurement statistics in 1934, financial value and the value that Americans placed on products and services were similar. A bigger economy meant things like toilets and electricity spreading across rural America, and cars and food and washing machines.
Today? Well, that’s less clear. According to the Bureau of Labor Statistics, the second fastest growing sector of the economy in terms of GDP growth from 2019-2024 was gambling. Philip Pilkington wrote a good essay last summer on the moral assumptions behind our growth statistics. There is no agreed upon notion of what makes up an economically valuable object or activity, so our stats are inherently subtle moral judgments. Classic moral philosophers like Adam Smith believed in the “use value” of an item, meaning how it could be used, whereas neoclassical economists believed in the “exchange value” of an item, making no judgments about use and are just counting up its market price.
Normal people subscribe on a moral level to use value. Most of us see someone spending money on a gambling addiction as doing something worse than providing Christmas presents for kids, but not because of price. However, our GDP models use the market value basis. Kuznets, presumably, was not amoral, he just thought that our laws would ban immoral activities like gambling, and so use value and market value wouldn’t diverge. But they have.
It’s not just things like gambling or pornography or speculation. A lot of previously unmeasured activity has been turned into data and monetized, which isn’t actually increasing real growth but measuring what already existed. Take the change from meeting someone at a party to using a dating app. One is part of GDP, the other isn’t. Both are real, but only one would show a bigger economy.
Beyond that much of our economy is now based on intangibles – the fastest growing sector was software publishing. Is Microsoft moving to a subscription fee model for Office truly some sort of groundbreaking new product? It’s hard to say, while corporate assets used to be hard things like factories, today much of it is intangibles like intellectual property.
A boomcession, where the rich and corporate America experience a boom while working people feel a recession, is a very unhealthy dynamic. It’s certainly possible to create metrics to measure it, and to help policymakers understand real income growth among different subgroups. You could start looking at real income after non-discretionary consumer spending, or find ways of adjusting for price discrimination.
But I think a better approach is to try to knit us into one society again. The kinds of policymakers who could try to create metrics to understand the different experiences of classes, and ameliorate them, don’t have power. Instead, the people in charge still use models which presume one economy and one relatively uniform set of prices, where “consumer spending” means stuff consumers want.
I once noted a speech in 2016 by then-Fed Chair Janet Yellen in which she expressed surprise that powerful rich firms and small weak ones had different borrowing rates, which affected the “monetary transmission channel” the Fed relied on. Sure it was obvious in the real world, but she preferred theory.
Or they don’t use models at all; Kevin Warsh is not an economist, he’s a lawyer and political operative, and is uninterested in academic theory. He cares about corporate profits and capital formation. That probably won’t work out well either.
At any rate, we have to start measuring what matters again. If we don’t, then we’ll continue to be baffled that normal people hate the economy that looks fine on our charts…
The models used by policymakers to understand wages, economic growth, and consumer spending are misleading. That’s why corporate America is having a party, and everyone else is mad. Eminently worth reading in full: “The Boomcession: Why Americans Hate What Looks Like an Economic Boom,” from @matthewstoller.bsky.social (or @mattstoller.skystack.xyz).
* Richard Hamming (and also to the article above, see “Goodhart’s law“)
###
As we ponder the pecuniary, we might recall that it was on this date in 1958 that Benelux Economic Union was founded, creating the seed from the European Economic Community, then the European Union grew.
On that same day, Philadelphia doo wop group The Silhouettes started five weeks at the top of the Billboard R&B chart with their first single, “Get A Job.”
“A commodity appears at first sight an extremely obvious, trivial thing. But its analysis brings out that it is a very strange thing”*…

Prices are on everyone’s minds these days. Brian Potter looks underneath the costs of the finished products and services that we typically track to examine the costs of the commodities that go into them…
This American Enterprise Institute chart [above], which breaks down price changes for different types of goods and services in the consumer price index, has by now become very widely known. A high-level takeaway from this chart is that labor-intensive services (education, healthcare) get more expensive in inflation-adjusted terms over time, while manufactured goods (TVs, toys, clothing) get less expensive over time.
But there are many types of goods that aren’t shown on this chart. One example is commodities: raw (or near-raw) materials mined or harvested from the earth. Commodities have many similarities with manufactured goods: they’re physical things that are produced (or extracted) using some sort of production technology (mining equipment, oil drilling equipment), and many of them will go through factory-like processing steps (oil refineries, blast furnaces). But commodities also seem distinct from manufactured goods. For one, because they’re often extracted from the earth, commodities can be subject to depletion dynamics: you run out of them at one location, and have to go find more somewhere else. In my book I talk about how iron ore used to be mined from places like Minnesota, but as the best deposits were mined out steel companies increasingly had to source their ore from overseas. And the idea of “Peak Oil” is based on the idea that society will use up the easily accessible oil, and be forced to obtain it from increasingly marginal, expensive-to-access locations.
(Some commodities, particularly agricultural commodities that can be repeatedly grown on a plot of land, don’t have the same sort of depletion dynamics, though bad farming practices can degrade a plot of land over time. Other commodities get naturally replenished over time, but can still get used up if the rate of extraction exceeds the rate of replenishment; non-farmed timber harvesting and non-farmed commercial fishing come to mind as examples.)
Going into this topic, I didn’t have a great sense of what price trends look like for commodities in general. Julian Simon famously won a 1980 bet with Paul Ehrlich that several raw materials — copper, chromium, nickel, tin, and tungsten — would be cheaper (in inflation-adjusted terms) after 10 years, not more expensive. But folks have pointed out that if the bet had been over a different 10-year window, Ehrlich would have won the bet.
To better understand how price tends to change for different commodities and raw materials, I looked at historical prices for over a hundred different commodities. Broadly, agricultural commodities tend to get cheaper over time, while fossil fuels have a slight tendency to get more expensive. Minerals (chemicals, metals, etc.) have a slight tendency towards getting cheaper, with a lot of variation — 15 minerals more than doubled in price over their respective time series. But this has shifted over the last few decades, and recently there’s been a greater tendency for commodities to rise in price…
[Potter offers a thorough– and fascinating– analysis, concluding…]
… historically commodities have generally fallen in price over time, but recently this trend has increasingly shifted towards rising prices. Natural gas and oil got cheaper until the 1950s and the 1970s, respectively, and since then have gotten more expensive. Beef and pork both got cheaper from 1970 until the 1990s, and since then have risen in price. Agricultural products were almost uniformly falling in price until around 2000, and have almost uniformly risen in price since then.
My general sense looking at historical commodity price data is that the more that production of some commodity looks like manufacturing — produced by a repetitive process that can be steadily improved and automated, from a supply that can be scaled up in a relatively straightforward fashion, without being subject to severe depletion dynamics — the more you’ll tend to see prices fall over time. The biggest decline in price of any commodity I looked at is industrial diamonds, which fell in price by 99.9% between 1900 and 2021d ue to advances in lab-grown diamonds production. This effectively replaced mined diamonds with manufactured ones for industrial uses; roughly 99% of industrial diamonds today are synthetic. Many other commodities had major price declines that were the result of production process improvements — aluminum got cheaper thanks to the invention (and subsequent improvements) of the Hall-Heroult smelting process, titanium’s price declined following the introduction of the Kroll process, and so on. (Steel also got much cheaper following the introduction of the Bessemer process, but that predates USGS price data.) And of course agriculture, which has evolved from crops being harvested manually to being harvested with highly automated, continuous process machinery, closely mirrors the sorts of process improvements we see in manufacturing.
Of course, this trend alone can’t explain changes in commodity prices over time, and there are plenty of commodities — steel, cement, silicon — that are produced in a manufacturing-type operation but which haven’t seen substantially declining prices over their history. And even commodities which resemble manufactured goods have risen in price recently. More generally, there are plenty of things that can shift supply and demand curves to the right or left: cartels, national policies, a spike or collapse in demand, and so on. But the question of “how much, over time, does the production of this commodity resemble a manufacturing process?” seems like a useful lens on understanding the dynamics of commodity prices…
“Do Commodities Get Cheaper Over Time?” from @constructionphysics.skystack.xyz.
* Karl Marx
###
As we brush up on the basics, we might recall that this date in the anniversary of two events that spurred commodity consumption.
Alexander Graham Bell spurred a boom on copper consumption when, on this date in 1915, he placed the first transcontinental phone call, from New York to San Francisco, where the Panama–Pacific International Exposition celebrations were underway and his assistant, his assistant Thomas Augustus Watson stood by. Bell repeated his famous first telephonic words, “Mr. Watson, come here. I want you,” to which Watson this time replied “It will take me five days to get there now!” Bell’s call officially initiated AT&T’s transcontinental service.

And, on this date 45 years later, in 1959, the aluminum market got a boost when the first non-stop transcontinental commercial jet trip was made by an American Airlines Boeing 707, from Los Angeles to New York. The sleek silver plane made the flight in airline official time of 4 hours and 3 minutes, half the usual scheduled time for the prop-driven DC- 7Cs then in regular use on that route.

“It’s easy to meet expenses – everywhere we go, there they are.”*…

… And those expenses seem to keep rising. Ben Brubaker weighs in on one ever-more-timely culprit…
Imagine a town with two widget merchants. Customers prefer cheaper widgets, so the merchants must compete to set the lowest price. Unhappy with their meager profits, they meet one night in a smoke-filled tavern to discuss a secret plan: If they raise prices together instead of competing, they can both make more money. But that kind of intentional price-fixing, called collusion, has long been illegal. The widget merchants decide not to risk it, and everyone else gets to enjoy cheap widgets.
For well over a century, U.S. law has followed this basic template: Ban those backroom deals, and fair prices should be maintained. These days, it’s not so simple. Across broad swaths of the economy, sellers increasingly rely on computer programs called learning algorithms, which repeatedly adjust prices in response to new data about the state of the market. These are often much simpler than the “deep learning” algorithms that power modern artificial intelligence, but they can still be prone to unexpected behavior.
So how can regulators ensure that algorithms set fair prices? Their traditional approach won’t work, as it relies on finding explicit collusion. “The algorithms definitely are not having drinks with each other,” said Aaron Roth, a computer scientist at the University of Pennsylvania.
Yet a widely cited 2019 paper showed that algorithms could learn to collude tacitly, even when they weren’t programmed to do so. A team of researchers pitted two copies of a simple learning algorithm against each other in a simulated market, then let them explore different strategies for increasing their profits. Over time, each algorithm learned through trial and error to retaliate when the other cut prices — dropping its own price by some huge, disproportionate amount. The end result was high prices, backed up by mutual threat of a price war.
Implicit threats like this also underpin many cases of human collusion. So if you want to guarantee fair prices, why not just require sellers to use algorithms that are inherently incapable of expressing threats?
In a recent paper, Roth and four other computer scientists showed why this may not be enough. They proved that even seemingly benign algorithms that optimize for their own profit can sometimes yield bad outcomes for buyers. “You can still get high prices in ways that kind of look reasonable from the outside,” said Natalie Collina, a graduate student working with Roth who co-authored the new study…
Read on for more on recent findings that reveal that even simple pricing algorithms can make things more expensive: “The Game Theory of How Algorithms Can Drive Up Prices,” from @benbenbrubaker.bsky.social in @quantamagazine.bsky.social.
See also the charmingly-understatedly-titled “AI-Driven Personalized Pricing May Not Help Consumers.“
* anonymous
###
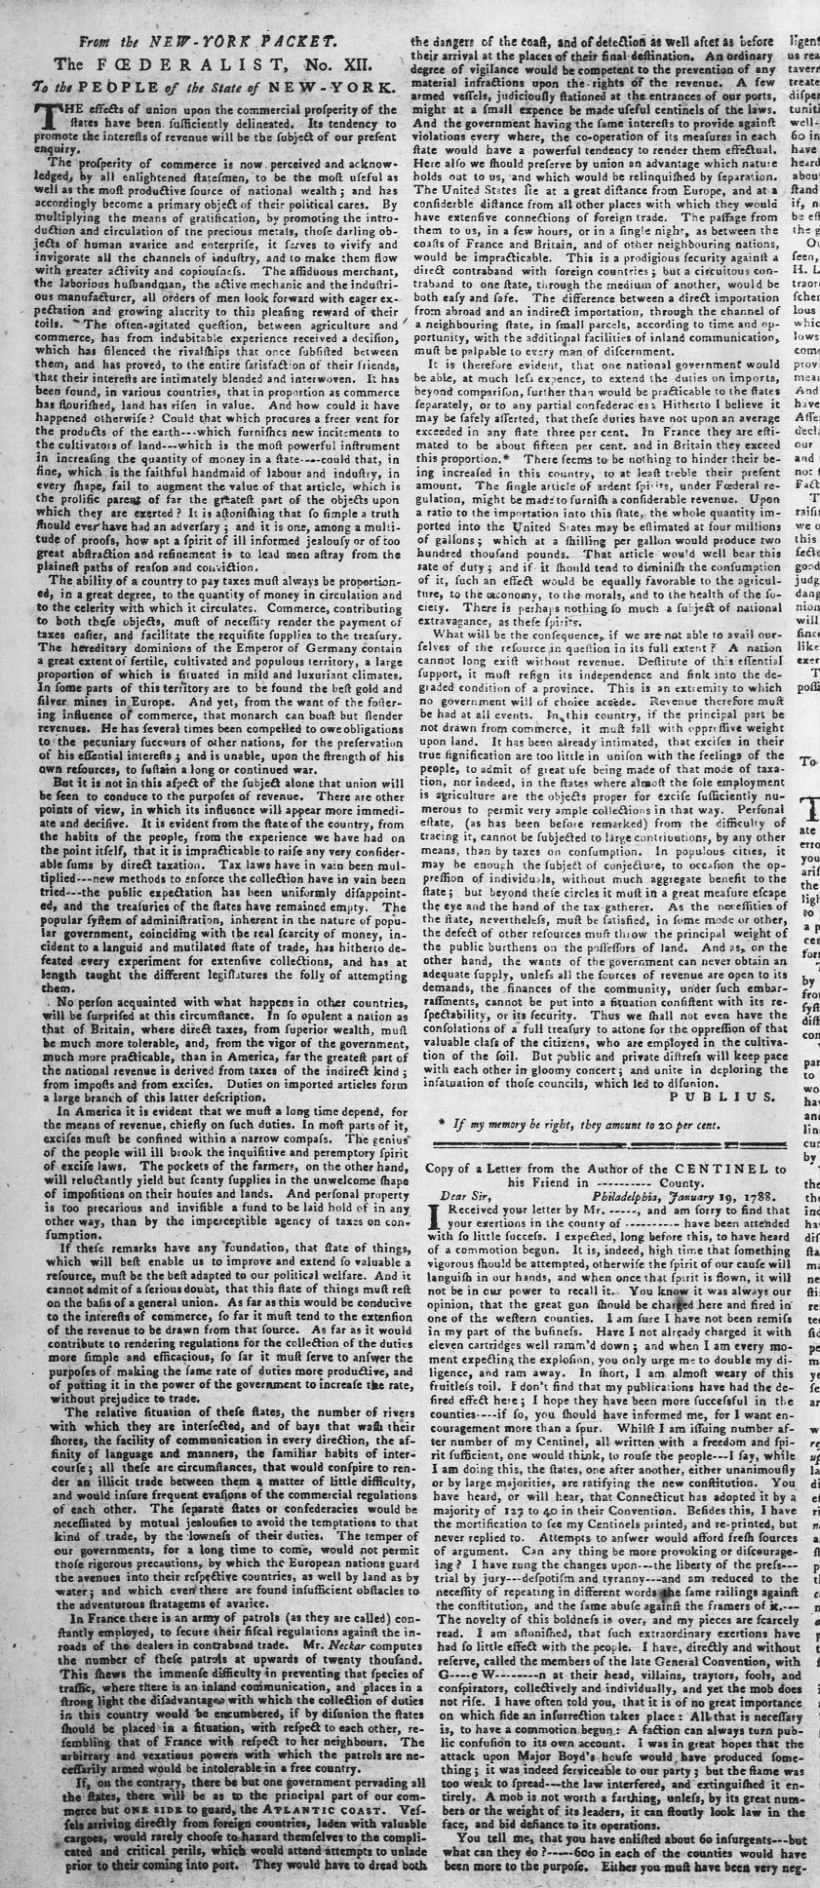
As we muse on malign mechanisms, we might recall that it was on this date in 1787 that the first in a series of eighty-five essays by “Publius,” the shared pen name of Alexander Hamilton, James Madison, and John Jay, appeared in the Independent Journal, a New York newspaper. Known collectively as The Federalist Papers, they were an effort to urge New Yorkers to support ratification of the Constitution approved by the Constitutional Convention on September 17, 1787. While aimed at New Yorkers, the essays were reprinted in newspapers (and pamphlets) across the fledgling nation.
In Federalist Paper #12, Alexander Hamilton (later the first Secretary of the Treasury) articulated an argument for the economic advantages of a united government under the proposed Constitution– and sketched the outline of the financial and commercial regime we’ve built since.
Your correspondent is heading into a series of meeting sufficiently intense that (R)D will be on brief hiatus. Regular service should resume on October 30.
“Statistics are like bikinis. What they reveal is suggestive, but what they conceal is vital.”*…

Former Comptroller of the Currency Eugene Ludwig argues that, at least insofar as many (maybe most) Americans are concerned, unemployment is higher, wages are lower, and growth is less robust than government statistics suggest…
Before the presidential election, many Democrats were puzzled by the seeming disconnect between “economic reality” as reflected in various government statistics and the public’s perceptions of the economy on the ground. Many in Washington bristled at the public’s failure to register how strong the economy really was. They charged that right-wing echo chambers were conning voters into believing entirely preposterous narratives about America’s decline.
What they rarely considered was whether something else might be responsible for the disconnect — whether, for instance, government statistics were fundamentally flawed. What if the numbers supporting the case for broad-based prosperity were themselves misrepresentations? What if, in fact, darker assessments of the economy were more authentically tethered to reality?
On some level, I relate to the underlying frustrations. Having served as comptroller of the currency during the 1990s, I‘ve spent substantial chunks of my career exploring the gaps between public perception and economic reality, particularly in the realm of finance. Many of the officials I’ve befriended and advised over the last quarter-century — members of the Federal Reserve, those running regulatory agencies, many leaders in Congress — have told me they consider it their responsibility to set public opinion aside and deal with the economy as it exists by the hard numbers. For them, government statistics are thought to be as reliable as solid facts.
In recent years, however, as my focus has broadened beyond finance to the economy as a whole, the disconnect between “hard” government numbers and popular perception has spurred me to question that faith. I’ve had the benefit of living in two realms that seem rarely to intersect — one as a Washington insider, the other as an adviser to lenders and investors across the country. Toggling between the two has led me to be increasingly skeptical that the government’s measurements properly capture the realities defining unemployment, wage growth and the strength of the economy as a whole.
These numbers have time and again suggested to many in Washington that unemployment is low, that wages are growing for middle America and that, to a greater or lesser degree, economic growth is lifting all boats year upon year. But when traveling the country, I’ve encountered something very different…
… Within the nation’s capital, this gap in perception has had profound implications. For decades, a small cohort of federal agencies have reported many of the same economic statistics, using fundamentally the same methodology or relying on the same sources, at the same appointed times. Rarely has anyone ever asked whether the figures they release hew to reality. Given my newfound skepticism, I decided several years ago to gather a team of researchers under the rubric of the Ludwig Institute for Shared Economic Prosperity to delve deeply into some of the most frequently cited headline statistics.
What we uncovered shocked us. The bottom line is that, for 20 years or more, including the months prior to the election, voter perception was more reflective of reality than the incumbent statistics. Our research revealed that the data collected by the various agencies is largely accurate. Moreover, the people staffing those agencies are talented and well-intentioned. But the filters used to compute the headline statistics are flawed. As a result, they paint a much rosier picture of reality than bears out on the ground.
Take, as a particularly egregious example, what is perhaps the most widely reported economic indicator: unemployment. Known to experts as the U-3, the number misleads in several ways. First, it counts as employed the millions of people who are unwillingly under-employed — that is, people who, for example, work only a few hours each week while searching for a full-time job. Second, it does not take into account many Americans who have been so discouraged that they are no longer trying to get a job. Finally, the prevailing statistic does not account for the meagerness of any individual’s income. Thus you could be homeless on the streets, making an intermittent income and functionally incapable of keeping your family fed, and the government would still count you as “employed.”
I don’t believe those who went into this past election taking pride in the unemployment numbers understood that the near-record low unemployment figures — the figure was a mere 4.2 percent in November — counted homeless people doing occasional work as “employed.” But the implications are powerful. If you filter the statistic to include as unemployed people who can’t find anything but part-time work or who make a poverty wage (roughly $25,000), the percentage is actually 23.7 percent. In other words, nearly one of every four workers is functionally unemployed in America today — hardly something to celebrate…
[Ludwig similarly analyzes data on wages, inflation, and GDP, finding them similarlly flawed…]
… Take all of these statistical discrepancies together. What we have here is a collection of economic indicators that all point in the same misleading direction. They all shroud the reality faced by middle- and lower-income households. The problem isn’t that some Americans didn’t come out ahead after four years of Bidenomics. Some did. It’s that, for the most part, those living in more modest circumstances have endured at least 20 years of setbacks, and the last four years did not turn things around enough for the lower 60 percent of American income earners.
To be fair, the prevailing indicators aren’t without merit. It is, for example, useful to know how the wages of full-time employees have evolved. The challenge, quite separate from any quibbling with the talented people working to tell the nation’s economic story, is to provide policymakers with a full picture of the reality faced by the bulk of the population. What we need is to find new ways to provide a more realistic picture of the nation’s underlying economic conditions on a monthly basis. The indicators my colleagues and I have constructed could serve as the basis for or inspiration for government-sponsored alternatives. Regardless, something needs to change.
This should not be a partisan issue — policymakers in both parties would benefit from gleaning a more accurate sense of what’s happening at the ground level of the American economy. In reality, both Democrats and Republicans were vulnerable to being snowed in the 2024 cycle — it just happened that the dissatisfaction during this particular cycle undermined the incumbent party.
In an age where faith in institutions of all sorts is in free fall, Americans are perpetually told, per a classic quote from former Sen. Daniel Patrick Moynihan, that while we may be entitled to our own opinions, we aren’t entitled to our own facts. That should be right, at least in the realm of economics. But the reality is that, if the prevailing indicators remain misleading, the facts don’t apply. We have it in our grasp to cut through the mirage that led Democrats astray in 2024. The question now is whether we will correct course…
On the need to revise our economic reference statistics: “Voters Were Right About the Economy. The Data Was Wrong.” from @LISEP_org in @POLITICOMag. Eminently worth reading in full.
More on (and more-current readings of) the suggested “revised metrics” at the Ludwig Institute for Shared Economic Prosperity.
###
As we muse on measurement and meaning, we might recall that it was on this date in 1979 that The Cars released “Good Times Roll,” the third single from their eponymously-titled debut album.

“Inflation hasn’t ruined everything. A dime can still be used as a screwdriver.”*…
As the recent election reminds us, inflation is a central issue to millions. How we calculate inflation has always been a subject of debate. And, as Carola Conches Binder explains, small changes that might seem trivial can lead to enormous changes in how well-off we think we are…
Every month, the US Bureau of Labor Statistics releases its newest data on the consumer price index (CPI). The CPI report is eagerly awaited by economists and policy wonks and investors. It garners heavy news coverage as a key piece of information in macroeconomic policymaking and analysis. The CPI and related measures affect monetary and fiscal policymaking and are often used to adjust Social Security payments, income tax brackets, and wages for millions of workers. Because of these far-reaching impacts, even relatively small changes in the measurement of the CPI can have major implications for households, firms, and the government’s budget. Thus, the technocratic task of measuring the price level is often at the center of political controversies. The evolution of inflation measurement in the United States has reflected both technical progress and these political forces.
The government’s role in the collection and publication of price indexes has been politically controversial from its origins, which were surprisingly late. Wesley Clair Mitchell, the former president of the American Economic Association, in 1921 called it:
a curious fact that men did not attempt to measure changes in the level of prices until after they had learned to measure such subtle things as the weight of the atmosphere, the velocity of sound, fluctuations of temperature, and the precession of the equinoxes . . . Perhaps disinclination on the part of ‘natural philosophers’ to soil their hands with such vulgar subjects as the prices of provisions was partly responsible for the delay…
[Binder recounts the history of price measurement, starting in Italy in the 18th century, explaining that economic and political pressures first resisted having indices at all, then struggled to shape them. She then compares the current approaches in use and unpacks the recent [and current] debate over whether we have inflation and if so, how much…]
… At the time of writing in 2024, inflation is falling by nearly any measure. But as Krugman’s super core episode [see here, here, and here] illustrates, the past few years have intensified public scrutiny of official price indexes and led to debates about their interpretations. In light of this scrutiny, it is important for national statistics agencies to maintain their credibility by adopting methodological improvements, learning from both the private sector and academic researchers, and communicating clearly with the public.
Just as the Bureau of Labor Statistics responded to the Stigler and Boskin Commissions by revising its methods, it has also responded to the Covid-19 pandemic and post-pandemic inflation. For example, the pandemic demonstrated that biennial (every other year) updates to the CPI expenditure weights are too infrequent in times of rapid economic changes. The pandemic very quickly shifted the types of goods and services that people were buying, so expenditure weights based on survey data from 2018 became out of date. People were spending more on food and other items facing large price increases, and less in categories experiencing falling prices, like transportation, implying that the official CPI measure was underestimating inflation.
The Bureau of Labor Statistics could not move quickly enough to change its estimates of expenditure weights, but private researchers could. The economist Alberto Cavallo used data collected from credit and debit card transactions to build his own set of weights that he used to construct a new Covid CPI measure, which indeed rose more quickly than the official CPI in the first months of the pandemic…
Cavallo’s experience constructing alternatives to official inflation statistics began when his home country, Argentina, began doctoring its inflation statistics in 2007 to hide inflation that rose above 12 percent in 2006 and likely averaged above 20 percent from 2007 to 2011. Cavallo and a group called the Billion Prices Project at MIT used web-scraping techniques to collect the prices of goods sold online in Argentina and four other Latin American countries. For all but Argentina, the price indexes based on online prices closely tracked official price indexes, but for Argentina, Cavallo’s estimates of inflation were three times higher than official estimates, and Cavallo’s estimates soon became more trusted than the official statistics.
Cavallo and the other researchers behind the Billion Prices Project have since extended their methodology to other countries, including the United States. In 2011, they started a private company called PriceStats that produces daily-frequency inflation measures for central banks and financial-sector customers in 25 countries, including the United States, using data on millions of product prices from hundreds of retailers.
In the United States, private inflation estimates may supplement the official estimates, but are unlikely to replace them. In part, this reflects the statistical agencies’ willingness to refine their methods, learn from private researchers, and maintain methodological transparency. For example, having learned that biennial expenditure weight updates are too infrequent, the BLS will update its expenditure weights every year beginning in 2023. The BLS also recently sponsored a study, Modernizing the Consumer Price Index for the 21st Century, to investigate additional improvements to the CPI that could be adopted in years to come. The study’s panelists considered a variety of innovations by Cavallo and other researchers, and recommended that the BLS experiment with using a wider variety of data sources, including online transactional data, to improve the timeliness and accuracy of its estimates.
The development of price and inflation measures has often been driven by political controversies, especially during times of war or during labor disputes. The development of the consumer price index arose from a need to ensure that wages and benefits would keep up with the cost of living. The recommendations of several different commissions have led to changes in how the index is computed – changes that have major impacts on the federal budget and on the distribution of resources. Especially in recent years, alternative inflation measures have proliferated. Overall, the official price indexes represent a tremendous intellectual and public achievement, despite the debates that continue to surround their use and interpretation…
Measuring price changes: “Where inflation comes from,” by @cconces in @WorksInProgMag.
(Image above: source)
* H. Jackson Brown Jr.
###
As we muse on measurement, we might note that today marks the anniversary of another measurement regime that supplanted what had been a largely an informal (and often intuitive) understanding of a basic fact of life: on this date in 1883, precisely at noon, North American railroads switched to a new standard time system for rail operations, which they called Standard Railway Time (SRT). Almost immediately after being implemented, many American cities enacted ordinances adopting the standard, thus resulting in the creation of time “zones” in the U.S.– Eastern, Central, Mountain, and Pacific. Though tailored to the railroad companies’ train schedules, the new system was quickly adopted nationwide, forestalling federal intervention in civil time for more than thirty years, until 1918, when daylight saving time was introduced.

You must be logged in to post a comment.