Posts Tagged ‘measurment’
“Stercus accidit”*…
As we try to understand the rifts afflicting our nation and world, many turn to Marx and his framework of class. But in a provocative essay, Catherine Nichols suggests that it was David Hume (in an 1752 essay that identified the unfettering of wealth from land) who identified the origin of our political divisions…
Describing the political map in terms of Left and Right is an accepted convention all over the world, almost to the point of cliché. Yet it is surprisingly complicated to explain whose interests lie on each side of this spectrum. For example, if the Left supports the interests of workers over the interests of employers, why are Left-leaning regions of the United States and elsewhere in the world among the richest? When Japan and South Korea sought to become economic powerhouses in the later 20th century, they adopted Leftist policies such as strong public education, universal healthcare and increased gender equality – if countries seeking to compete in capitalist arenas adopt broadly Leftist policies, then how do we explain why Leftists are always talking about overthrowing capitalism? And if the Left is somehow both the party of workers’ rights and the party of material wealth, then whose interests are supported by the Right? Given such contradictions, how did these terms become so central to modern politics?
The terms ‘left’ and ‘right’ come from the seating arrangements in the National Assembly during the French Revolution, where the combatants used the medieval estate groupings to define their battle lines. According to their writings, land-owning aristocrats (the Second Estate) were the party of the Right, while the interests of nearly everyone else (the Third Estate) belonged to the Left. This Third Estate included peasants working for the landowners but also every other kind of business owner and worker. Decades later, Karl Marx offered a different analysis of capitalism: he put owners of both land and businesses together on one side (the bourgeoisie), while grouping workers from fields and factories on the other side (the proletariat) in a single, world-wide class struggle. The trouble with both these ways of parsing Left and Right is that voting patterns never seem to line up with class. Both historic analyses leave us with questions about the contemporary world – and not just the paradox of why so many Left-leaning places are so rich. Why, for example, do working-class conservatives appear to vote against their material interests, year in and year out, across generations?
The 18th-century philosopher and political theorist David Hume had answers to these questions, though he was writing decades before the French Revolution. While his essay ‘Of Public Credit’ (1752) was a warning about the dangers of Britain’s increasing reliance on debt financing, his apocalyptic vision of the future turned out to describe some features of our current political map surprisingly well. Hume was writing because he believed that debt financing had the power to upend Europe’s traditional power structure and culture by creating a new source of money divorced from tradition or responsibility: stocks and bonds. Unlike land, anyone with some cash could buy war bonds and get an immediate passive income in the form of interest. This was the thin end of the wedge caused by the debt financing that Hume believed was destroying every part of society. The governments of antiquity, Hume argued, saved money to use in battle and then waged wars in self-defence, or else to expand their territory. But the British had invented a new form of warfare that Hume saw no precedent for, even in the merchant states of Nicollò Machiavelli’s Italy: war for trade, funded with money borrowed from private stockholders…
[Nichols unpacks Hume’s observations (centrally, that three groups with stakes in the status quo, heretability, and the sanctity of “family and family hierarchy”tradition”– landowners, aging parents, and want to preserve old power structures, including the family– and traces their relevance, from Hume’s time to ours…]
… There are many reasons for people aligning Right or Left, which is why analyses of class and material interests fall short of describing the realities of people’s politics. Hume foresaw that these specific groups would resent the economic sea-change of the 18th century – and he was correct. Many people would rather have land and power than money and liberty.
Still, the power of the Right hasn’t doomed the Left – no more than the Spanish Inquisition doomed the rise of the Left in 18th-century England and France. As long as governments want to keep the value of their currencies from falling, someone in their ranks will be using the methods of the Left and inventiveness that brought us everything from our banking system to gay marriage. We don’t need to resurrect communism or focus narrowly on class, following Marx. The experiments are far from over, and we should remember that the Left is generally where money comes from in modern times. We give away too much power when we forget it…
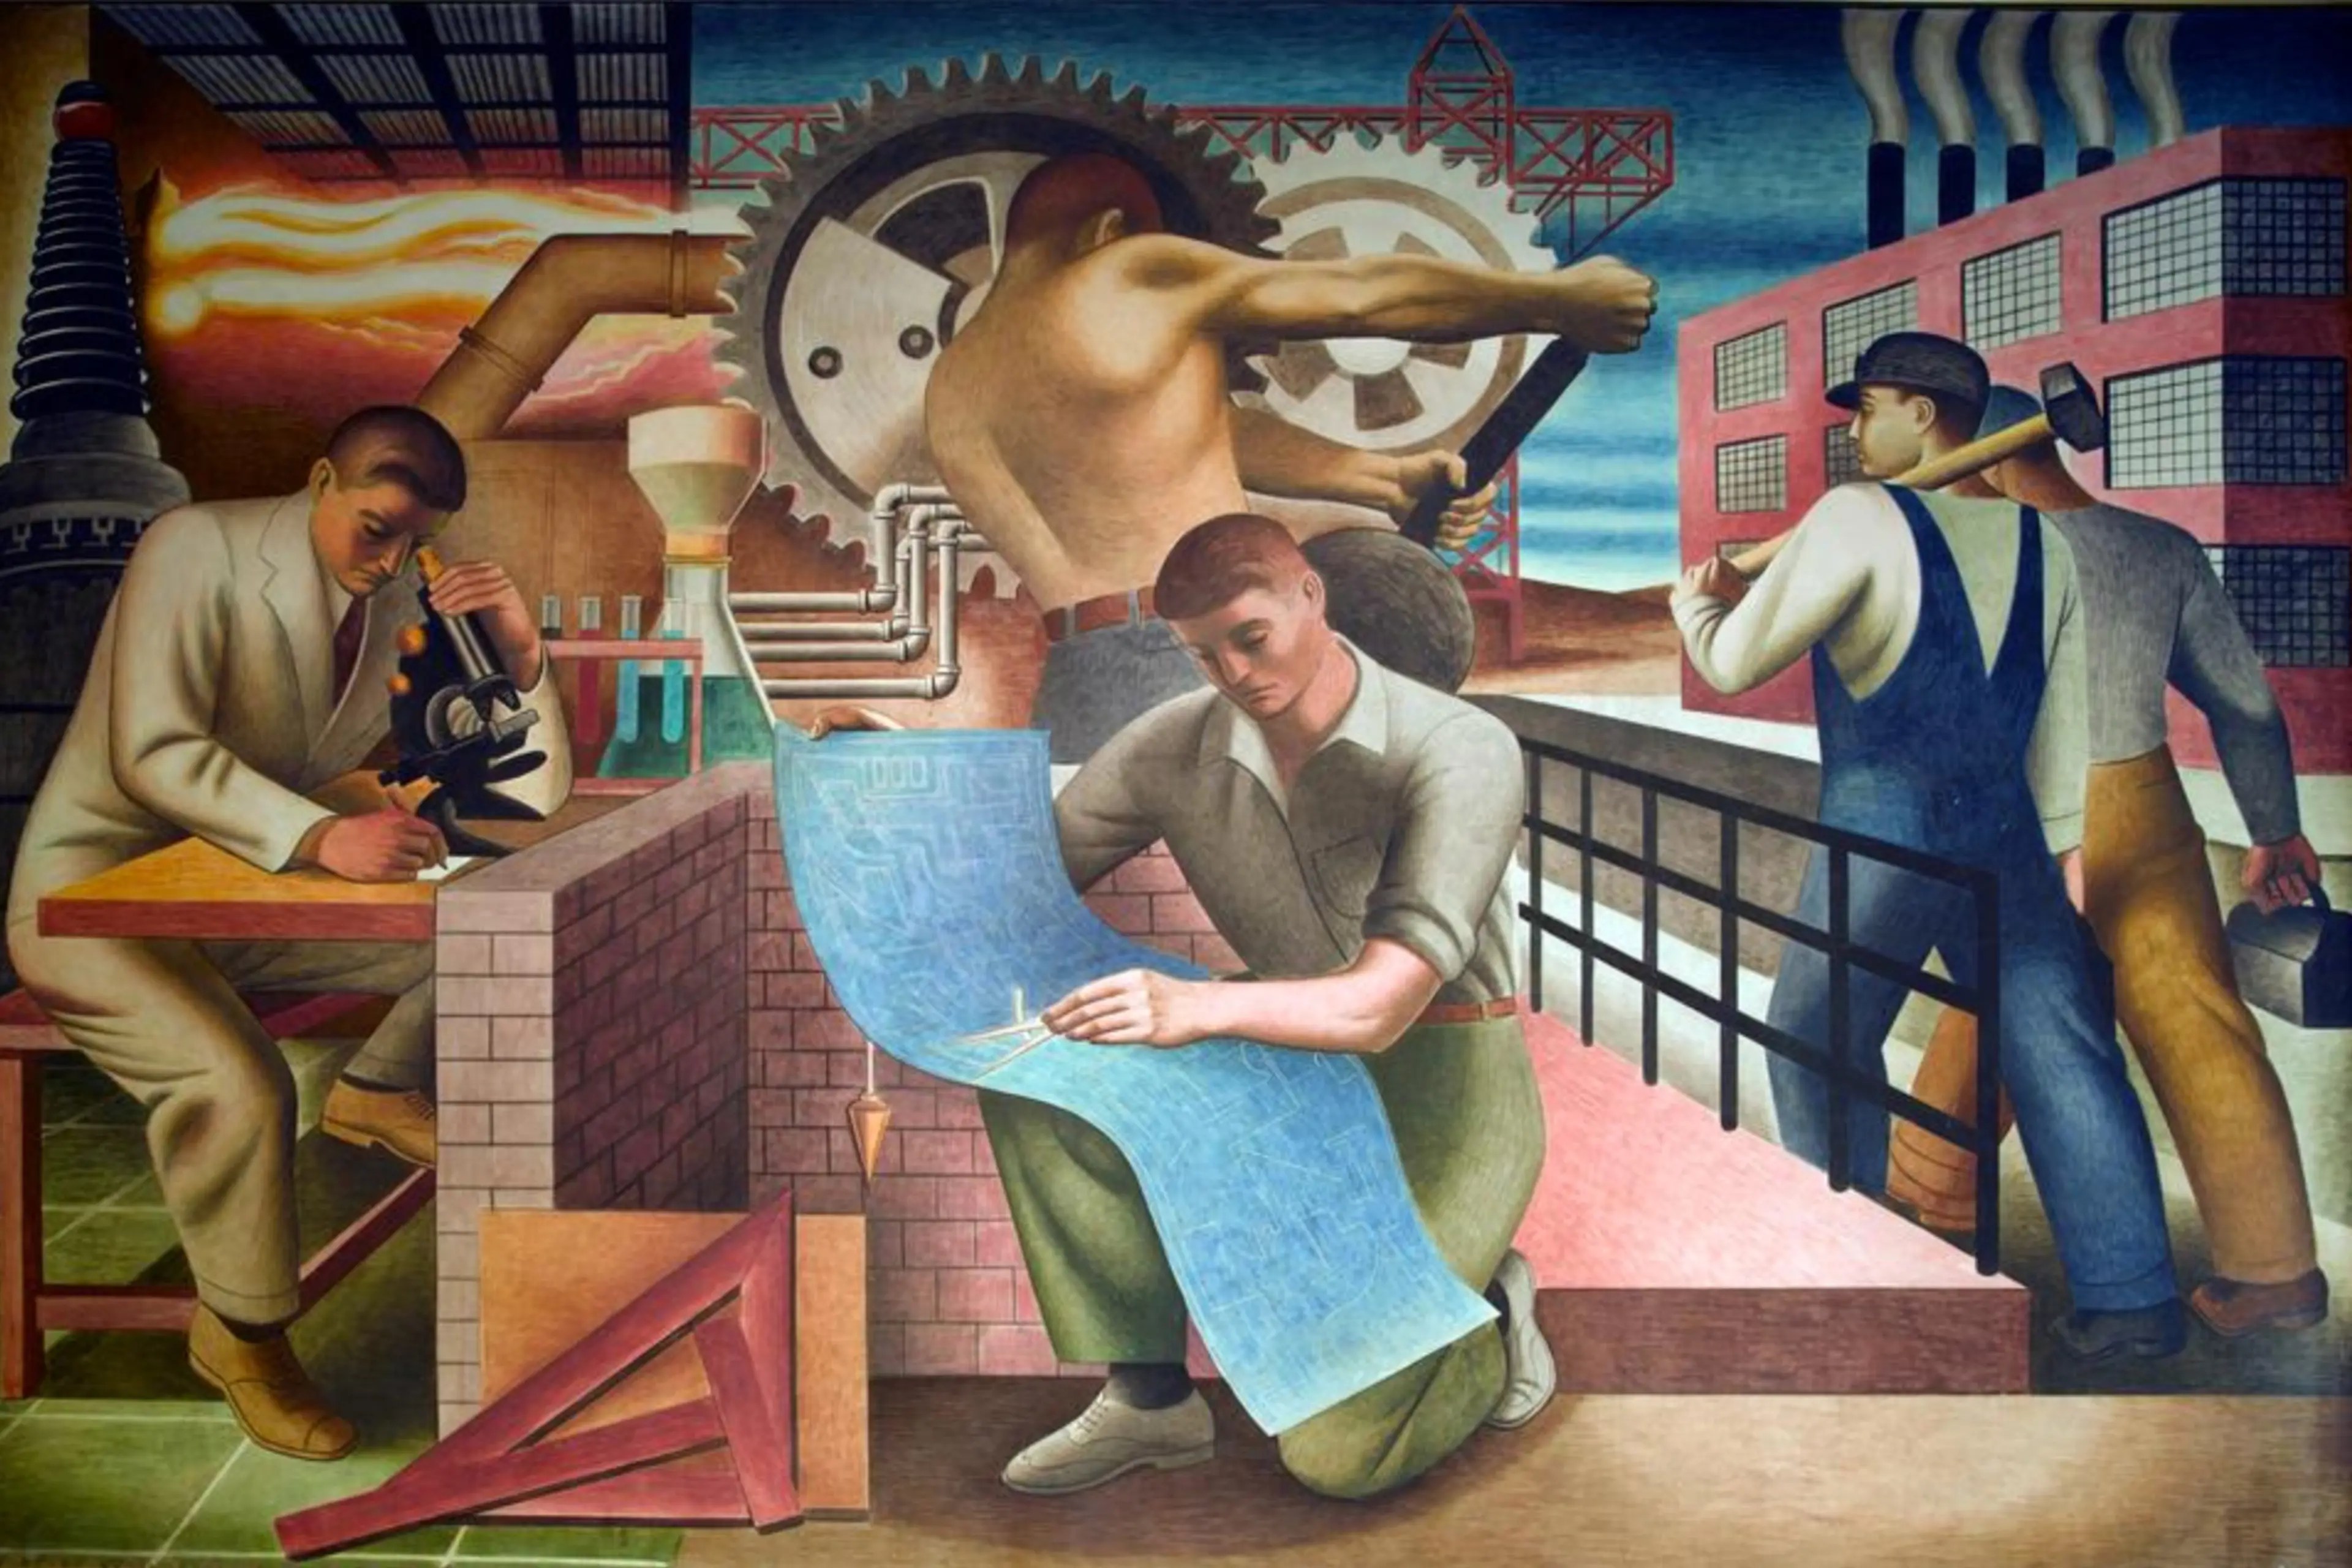
Rethinking Right and Left: “Landholder vs stockholder,” from @catherinenichols.bsky.social in @aeon.co.
As for how it’s going at the moment (and further to Hume and the quote in this post’s title), see: “MAGA’s Betrayal of Small Business,” from @pkrugman.bsky.social.
* “shit happens”– often attributed to David Hume, reflecting his skeptical view that human understanding, particularly of cause-and-effect, is limited to habitual belief from experience, implying that unforeseen, messy outcomes (“shit”) inevitably occur in life despite our reasoning.
###
As we sort the Whigs from the Tories, we might recall that it was on this date 1656 that Blaise Pascal (writing under the pseudonym Louis de Montalte) published the first of his Provential Letters (Lettres provinciales), a series of eighteen polemical letters using humor to attack Jesuits for their use of casuistry and their moral laxity. Though the Letters were a popular success, they had little immediate effect on politics or the clergy. But they influenced later French writers like Voltaire and Jean-Jacques Rousseau and ultimately persuaded Pope Alexander to condemn “laxity” in the church and order a revision of casuistic texts.

“Statistics are like bikinis. What they reveal is suggestive, but what they conceal is vital.”*…

Former Comptroller of the Currency Eugene Ludwig argues that, at least insofar as many (maybe most) Americans are concerned, unemployment is higher, wages are lower, and growth is less robust than government statistics suggest…
Before the presidential election, many Democrats were puzzled by the seeming disconnect between “economic reality” as reflected in various government statistics and the public’s perceptions of the economy on the ground. Many in Washington bristled at the public’s failure to register how strong the economy really was. They charged that right-wing echo chambers were conning voters into believing entirely preposterous narratives about America’s decline.
What they rarely considered was whether something else might be responsible for the disconnect — whether, for instance, government statistics were fundamentally flawed. What if the numbers supporting the case for broad-based prosperity were themselves misrepresentations? What if, in fact, darker assessments of the economy were more authentically tethered to reality?
On some level, I relate to the underlying frustrations. Having served as comptroller of the currency during the 1990s, I‘ve spent substantial chunks of my career exploring the gaps between public perception and economic reality, particularly in the realm of finance. Many of the officials I’ve befriended and advised over the last quarter-century — members of the Federal Reserve, those running regulatory agencies, many leaders in Congress — have told me they consider it their responsibility to set public opinion aside and deal with the economy as it exists by the hard numbers. For them, government statistics are thought to be as reliable as solid facts.
In recent years, however, as my focus has broadened beyond finance to the economy as a whole, the disconnect between “hard” government numbers and popular perception has spurred me to question that faith. I’ve had the benefit of living in two realms that seem rarely to intersect — one as a Washington insider, the other as an adviser to lenders and investors across the country. Toggling between the two has led me to be increasingly skeptical that the government’s measurements properly capture the realities defining unemployment, wage growth and the strength of the economy as a whole.
These numbers have time and again suggested to many in Washington that unemployment is low, that wages are growing for middle America and that, to a greater or lesser degree, economic growth is lifting all boats year upon year. But when traveling the country, I’ve encountered something very different…
… Within the nation’s capital, this gap in perception has had profound implications. For decades, a small cohort of federal agencies have reported many of the same economic statistics, using fundamentally the same methodology or relying on the same sources, at the same appointed times. Rarely has anyone ever asked whether the figures they release hew to reality. Given my newfound skepticism, I decided several years ago to gather a team of researchers under the rubric of the Ludwig Institute for Shared Economic Prosperity to delve deeply into some of the most frequently cited headline statistics.
What we uncovered shocked us. The bottom line is that, for 20 years or more, including the months prior to the election, voter perception was more reflective of reality than the incumbent statistics. Our research revealed that the data collected by the various agencies is largely accurate. Moreover, the people staffing those agencies are talented and well-intentioned. But the filters used to compute the headline statistics are flawed. As a result, they paint a much rosier picture of reality than bears out on the ground.
Take, as a particularly egregious example, what is perhaps the most widely reported economic indicator: unemployment. Known to experts as the U-3, the number misleads in several ways. First, it counts as employed the millions of people who are unwillingly under-employed — that is, people who, for example, work only a few hours each week while searching for a full-time job. Second, it does not take into account many Americans who have been so discouraged that they are no longer trying to get a job. Finally, the prevailing statistic does not account for the meagerness of any individual’s income. Thus you could be homeless on the streets, making an intermittent income and functionally incapable of keeping your family fed, and the government would still count you as “employed.”
I don’t believe those who went into this past election taking pride in the unemployment numbers understood that the near-record low unemployment figures — the figure was a mere 4.2 percent in November — counted homeless people doing occasional work as “employed.” But the implications are powerful. If you filter the statistic to include as unemployed people who can’t find anything but part-time work or who make a poverty wage (roughly $25,000), the percentage is actually 23.7 percent. In other words, nearly one of every four workers is functionally unemployed in America today — hardly something to celebrate…
[Ludwig similarly analyzes data on wages, inflation, and GDP, finding them similarlly flawed…]
… Take all of these statistical discrepancies together. What we have here is a collection of economic indicators that all point in the same misleading direction. They all shroud the reality faced by middle- and lower-income households. The problem isn’t that some Americans didn’t come out ahead after four years of Bidenomics. Some did. It’s that, for the most part, those living in more modest circumstances have endured at least 20 years of setbacks, and the last four years did not turn things around enough for the lower 60 percent of American income earners.
To be fair, the prevailing indicators aren’t without merit. It is, for example, useful to know how the wages of full-time employees have evolved. The challenge, quite separate from any quibbling with the talented people working to tell the nation’s economic story, is to provide policymakers with a full picture of the reality faced by the bulk of the population. What we need is to find new ways to provide a more realistic picture of the nation’s underlying economic conditions on a monthly basis. The indicators my colleagues and I have constructed could serve as the basis for or inspiration for government-sponsored alternatives. Regardless, something needs to change.
This should not be a partisan issue — policymakers in both parties would benefit from gleaning a more accurate sense of what’s happening at the ground level of the American economy. In reality, both Democrats and Republicans were vulnerable to being snowed in the 2024 cycle — it just happened that the dissatisfaction during this particular cycle undermined the incumbent party.
In an age where faith in institutions of all sorts is in free fall, Americans are perpetually told, per a classic quote from former Sen. Daniel Patrick Moynihan, that while we may be entitled to our own opinions, we aren’t entitled to our own facts. That should be right, at least in the realm of economics. But the reality is that, if the prevailing indicators remain misleading, the facts don’t apply. We have it in our grasp to cut through the mirage that led Democrats astray in 2024. The question now is whether we will correct course…
On the need to revise our economic reference statistics: “Voters Were Right About the Economy. The Data Was Wrong.” from @LISEP_org in @POLITICOMag. Eminently worth reading in full.
More on (and more-current readings of) the suggested “revised metrics” at the Ludwig Institute for Shared Economic Prosperity.
###
As we muse on measurement and meaning, we might recall that it was on this date in 1979 that The Cars released “Good Times Roll,” the third single from their eponymously-titled debut album.

You must be logged in to post a comment.