Posts Tagged ‘data’
“Do not fold, spindle, or mutilate”*…

Punched cards have a long history in machine control (dating back to Jacquard) and computing (starting with Babbage‘s Difference Engine), but it was Herman Hollerith who brought them into modern computation in the late 1880s… where punch cards remained for about 100 years. From the Smithsonian’s American History Museum…
In the late 1880s, American engineer Herman Hollerith saw a railroad punch card when he was trying to figure out new ways of compiling statistical information for the U.S. Census. His first punch card, like those used on railways, only had holes along the edges. The meaning of each hole was indicated on the card. By the time Hollerith tabulating equipment was used in the 1890 U.S. Census, holes were scattered across the cards, although their meaning was not indicated on it.
Hollerith and his employees at the Tabulating Machine Company in Washington, D.C. soon developed punched cards for use in compiling information for commercial enterprises such as railroads. They and staff of the U.S. Census Bureau prepared improved machines—these devices are shown in the object group on tabulating equipment. By the 1920s, the United States had two major manufacturers of punch card equipment, International Business Machines (the descendent of the Tabulating Machine Company) and Remington Rand (the descendent of Powers Accounting Machine Company established by Russian emigré and former Census Bureau employee James Powers). Each manufacturer developed a distinctive standard punch card. IBM cards had eighty columns of rectangular holes while those of Remington Rand had ninety columns of circular holes. Tabulating machines were widely used in both government and commerce, with cards designed to meet the needs of customers. For example, checks issued by the U.S. government often came on punch cards.
When IBM and Remington Rand began selling electronic computers in the years following World War II, punch cards became the preferred method of entering data and programs onto them. They also were used in later minicomputers and some early desktop calculators. Punch cards surviving in the Smithsonian collections reflect the widespread use of computers – they announced scores on standardized tests, served as a library cards, were part of the proof of mathematical theorems, and kept medical records. Some are printed with the names of users, from university computer centers and computer clubs to the Library of Congress to Bell Laboratories…
Browse the collection: “Punch Cards for Data Processing“
See also: here, here, and here.
* Ubiquitous warning on punch cards:
… in the 1950s, after the invention of the computer and its widespread business use, that everyone began to see punch cards. Companies sent punch cards out with bills: the telephone company, utility companies, and even department stores realized that they could save a step in their billing process, as well as making it easier for them to process the returned check, by using the cards themselves as the bills. By the 1960s, punch cards were familiar, everyday objects.
While company employees could be trusted to take care of the cards, the person in the street could not. Warnings were necessary. In the 1930s the University of Iowa used cards for student registration; on each card was printed “Do not fold or bend this card.” Cards reproduced in an IBM sales brochure of the 1930s read “Do not fold, tear, or mutilate this card” and “Do not fold tear or destroy.” I’m not sure when the canonical “Do not fold, spindle, or mutilate” first appeared; it’s one of those traditions whose author and origin is lost in the mists of time. Let’s consider the words one at a time, stop and take them seriously…
– “A Cultural History of the Punch Card” (from 1991; eminently worth reading in full)
###
As we contemplate chads (of which, punch cards produced a gracious plenty), we might spare a thought for Gerald Hawkins; he died on this date in 2003. An astronomer and author, he was best known for his work in archaeoastronomy— most of all, for his 1965 book, Stonehenge Decoded. In the early 1960s, Hawkins had used punch cards to load data modeling sun and moon movements onto magnetic tapes, then into an IBM 7090. The results led him to conclude, as the book argues, that the features at the monument were arranged in such a way as to predict a variety of astronomical events– that Stonehenge was a giant prehistoric observatory and computer. While some archaeologists are hesitant to accept Hawkins’ theories, many archaeoastronomers have built upon his work. More widely, scholars accept that the importance of astronomical alignment and large complexes being planned and constructed to fulfill cosmology has been demonstrated at other prehistoric sites, such as the Snake Mound and Cahokia in the U.S.

“Privacy is rarely lost in one fell swoop. It is usually eroded over time, little bits dissolving almost imperceptibly until we finally begin to notice how much is gone.”*…

… And now, indeed, we’re beginning to notice. Hana Lee Goldin surveys the state of play– who’s buying our personal information, what they’re using it for, and how the system works behind the screen– and considers our options…
Sometime in the mid-2000s, most of us started handing over pieces of ourselves to the internet without giving the exchange a second thought. We created email accounts, signed up for social media, bought things online, downloaded apps, swiped loyalty cards, connected fitness trackers, stored photos in the cloud, and agreed to terms of service that almost none of us have ever read in full. We did this thousands of times over two decades and counting, and each interaction felt small enough to be inconsequential.
But the accumulation is enormous. More than 6 billion people now use the internet, and each one makes an estimated 5,000 digital interactions per day. Most of those interactions happen without our conscious awareness: a GPS ping, a page load, an app opening, a browser cookie refreshing, a device checking in with a cell tower. The average person in 2010 made an estimated 298 digital interactions per day. In fifteen years, that number multiplied more than sixteenfold. Those digital interactions produce records that can persist indefinitely, stored, copied, indexed, bought, sold, and combined with other records to build profiles of extraordinary detail.
If we’ve been online since the late 1990s or early 2000s, our data footprint can include social media accounts we’ve created, online purchases we’ve made, forums we’ve posted in, loyalty cards we’ve used, and apps we’ve installed going back decades. Some of that information lives on platforms we’ve long forgotten. Some of it was collected by companies that have since been acquired or dissolved, with our data potentially passing to successor entities we’ve never heard of. The digital life most of us have been living for 15 to 25 years has produced a layered, evolving archive that only grows more valuable to the people who buy and sell it as time goes on.
Most of us sense that something is off about all of this. In a 2023 survey, Pew Research found that roughly eight in ten Americans feel they have little to no control over the data companies collect about them, 71% are concerned about government data use, and 67% say they understand little to nothing about what companies are doing with their personal information. The concern is real and widespread. And so is the feeling of helplessness: 60% of Americans believe it’s impossible to go through daily life without having their data tracked. The unease is there. What’s missing is a clear picture of what’s happening on the other side of the transaction…
[Goldin explains what data is being collected and shared, and by whom; how the data is managed and trafficked; how its being used (by insurance and financial companies, employers and landlords, retailers, AI companies, governments, and criminals); and how “inferred” data is used to augment the “hard” data. It’s chilling. She then puts the issue into context, and discusses we we can– and cannot– do about it…]
… The philosopher Helen Nissenbaum has a framework for what’s happening here: contextual integrity. The idea is that privacy isn’t about secrecy. We share information willingly all the time, when the context fits. We tell our doctor about a health condition because we expect that information to stay within the medical relationship. We search for symptoms on a health website because we assume that search won’t follow us into an insurance application. In the current data economy, that’s exactly the kind of boundary that dissolves, because the company collecting the data and the company buying it are operating in completely different contexts.
This is an information literacy problem as much as a privacy problem. Information literacy is usually framed around consumption: evaluating sources, questioning claims, recognizing bias in what we read and watch. But every time we interact with a digital service, we’re also producing information: generating a record that will be read, interpreted, scored, and acted on by organizations we may never interact with directly. Many of us have gotten better at questioning the information that comes at us: checking sources, noticing bias, and recognizing when something is trying to sell us a conclusion. But we haven’t developed equivalent habits around the information that flows from us: where it goes after we hand it over, who reads the record, what incentives they have, and what conclusions they draw. The gap between what we think we’re consenting to and what we’ve agreed to in practice is where the real exposure lives, and the system is designed to keep that gap invisible.
One of the reasons the “so what” question is hard to answer with action is that opting out of data collection often means opting out of participation. Declining a social media platform’s terms of service means not using the platform. Refusing location permissions can mean losing access to navigation, ride-sharing, weather, and delivery apps. Choosing not to create an account can mean paying more, seeing less, or being locked out of services that have become essential infrastructure for work, communication, healthcare, banking, and education.
The architecture of digital consent treats data sharing as a binary: agree to the terms or don’t use the product. There’s rarely a middle option that allows us to use a service while limiting what data gets collected and where it goes. The result is that the “choice” to share data often functions as a condition of entry into daily life rather than an informed negotiation. We’re not handing over data because we’ve weighed the tradeoff and decided it’s fair. We’re handing it over because the alternative is exclusion from services we rely on.
This is the structural context behind the Pew Research Center finding that more than half of Americans believe it’s impossible to go through daily life without being tracked. For many of us, it isn’t possible, at least not without significant inconvenience or sacrifice. The question isn’t whether we can avoid data collection entirely, because for the vast majority of people who participate in modern life, the answer is no. The question is whether we can make more informed decisions within the constraints we’re operating in, and whether the system can be pushed – through regulation, through market pressure, through better tools – toward something more transparent.
California’s Delete Act, which took effect in January 2026, is the strongest example of what’s emerging. It created a platform called DROP (Delete Request and Opt-Out Platform) that lets California residents submit a single deletion request to every registered data broker in the state. Brokers are required to process those requests, maintain suppression lists to prevent re-collection, and check the platform regularly for new requests. The European Union’s GDPR provides similar individual rights, and a handful of other U.S. states have enacted their own privacy laws with varying levels of protection. But the coverage is uneven: what’s available to a California or EU resident may not extend to someone in a state without comparable legislation.
Some services now automate parts of the opt-out process, submitting removal requests to dozens of brokers on our behalf. These can’t erase the data trail entirely, but they can narrow what’s actively available for sale.
Beyond deletion, there are smaller choices that reduce how much new data we generate. We can audit which apps have permission to track our location or access our contacts, since a surprising amount of behavioral data comes from apps that don’t need those permissions to function. We can treat “sign in with Google” and “sign in with Facebook” buttons as what they are: data-sharing agreements that can link a new service to an existing profile. And we can glance at the first few lines of a privacy policy before agreeing, looking for some version of “we may share your information with our partners,” where “partners” just means anyone willing to pay.
Most of us don’t read privacy policies, and the policies aren’t built to be read. They average thousands of words of dense legal language filled with terms like “legitimate interest,” “data processor,” and “de-identified data.” Studies consistently put them at a late high school to early college reading level (grade 12 to 14), but the difficulty goes beyond reading level: the concepts are abstract, the volume of agreements we encounter is enormous, and the design of the consent process itself pushes us through as fast as possible. Pre-checked boxes, auto-scrolling agreement windows, “accept all” buttons positioned prominently while “customize settings” options sit behind additional clicks. These are dark patterns, design choices that make the path of least resistance the path of maximum data sharing.
The result is a gap between the moment we share a piece of information and the moment that information shapes a decision about our lives. We don’t connect the app to the insurance premium or the loyalty card to the rental application because the chain of custody between them is long, complex, and designed to stay out of view.
The same critical thinking we’ve learned to apply to the information flowing toward us (checking sources, questioning claims, looking for bias) applies to the information flowing from us: who’s collecting this, what will they do with it, who else will see it, and what did we agree to? The difference is that in the data economy, we’re the product being evaluated, and the questions are being asked about us rather than by us.
So can we get it back? Not entirely. Data that’s already been collected, copied, sold, and processed across multiple systems can’t be fully recalled. What we can do is reduce what’s actively available for sale, slow the flow of new data going forward, and take advantage of legal tools that didn’t exist a few years ago. The archive of our past digital lives is too distributed to undo, but the file is still being written, and we have more say over the next page than we did over the last twenty years of them.
So what if they have our data? The tradeoff extends well beyond better ads. It reaches into the prices we’re charged, the credit we’re offered, the jobs we’re considered for, the insurance premiums we pay, the AI systems trained on our behavior, the accuracy of the profiles used to make decisions about our lives, and the degree to which government agencies can monitor our movements without a warrant. Every new service we sign up for, every permission we grant, and every terms-of-service agreement we accept adds another layer to that file. We can’t close the file entirely, but we can make more informed decisions about what goes into it next…
Eminently worth reading in full: “So What if They Have My Data?“
See also: “Why Do We Care So Much About Privacy?” (source of the image above) in which Louis Menand suggests that our concern should be with the “weaponization” of data…
* Daniel J. Solove, Nothing to Hide: The False Tradeoff Between Privacy and Security
###
As we reinforce our rights, we might recall that it was on this date in 1996 that the internet-as-we’ve-come-to-know-it broke big into the mainstream: Yahoo! launched the national campaign that asked “Do You Yahoo?” advertising its web-based search service on national television. The campaign was created by ad agency Black Rocket and Yahoo Marketing Head Karen Edwards (whose many awards for the work include a seat in the Advertising Hall of Achievement).
An early spot from the campaign…
“Palantir is still not a data company”*…

Palantir, founded in 2003 by Peter Thiel, Stephen Cohen, Joe Lonsdale, and Alex Karp, has grown into a company with revenues approaching $3 Billion. It works for a number of giant corporations; but its power alley has, from the start, been insinuating itself into the U.S. government ever more intimately, becoming one of the few winners in the Trump administration’s cost-cutting push (and emerging as the chosen agent to compile data on all Americans).
Palantir has become a darling of the stock market, the top-performing stock in the S&P 500 for two years running. Its stock has risen nearly 150% this year and an incredible 2,000% since its 2020 debut.
But what’s fueling all of this? Is the company’s extraordinary valuation justified? Sustainable? But more fundamentally, what is it that Palantir actually does? Palantir is often called a data broker, a data miner, or a giant database of personal information. In reality, it’s none of these—but even former employees struggle to explain it. Caroline Haskins reports…
Palantir is arguably one of the most notorious corporations in contemporary America. Cofounded by libertarian tech billionaire Peter Thiel, the software firm’s work with Immigration and Customs Enforcement, the US Department of Defense, and the Israeli military has sparked numerous protests in multiple countries. Palantir has been so infamous for so long that, for some people, its name has become a cultural shorthand for dystopian surveillance.
But a number of former Palantir employees tell WIRED they believe the public still largely misunderstands what the company actually does and how its software works. Some people think it’s a data broker that buys information from private companies and resells it to the government. Others think it’s a data miner, constantly scanning the internet for unique insights it can collect and market to customers. Still others think it maintains a giant, centralized database of information collected from all of its clients. In reality, Palantir does none of these things, but the misconceptions continue to persist.
Palantir has tried to correct the record itself in a series of blog posts with titles like “Palantir Is Not a Data Company” and “Palantir Is Still Not a Data Company.” In the latter, Palantir explains that “misconceptions can arise because our products are complicated,” but nonetheless, “it is absolutely possible” to accurately describe them to “people who are curious.”
The problem, however, is that even ex-employees struggle to provide a clear description of the company. “It’s really hard to explain what Palantir works on or what it does,” says Linda Xia, who was an engineer at Palantir from 2022 to 2024. “Even as someone who worked there, it’s hard to figure out, how do you give a cohesive explanation?”
Xia was one of 13 former Palantir staffers who signed an open letter published in May arguing that the company risks being complicit in authoritarianism by continuing to cooperate with the Trump administration. She and other former Palantir staffers who spoke to WIRED for this story argue that, in order to grapple with Palantir and its role in the world, let alone hold the company accountable, you need to first understand what it really is.
It’s not that former employees literally don’t know what Palantir is selling. In interviews with WIRED, they spoke fluidly about how its software can connect and transform different kinds of data collected by government agencies and corporations. But when asked to, say, name its direct business competitors, two former Palantir employees who requested anonymity to speak freely about their experiences, struggled to come up with anything. “I still don’t know how to answer that question, to be honest,” says one.
Juan Sebastián Pinto, who worked as a content strategist at Palantir and also signed the open letter, says it sells software to other businesses, a category commonly referred to in Silicon Valley as B2B SaaS. Another former staffer says Palantir provides “really extravagant plumbing with data.”
Xia calls Foundry, one of Palantir’s flagship software platforms, “a collection of different applications” that customers use to “operationalize data.” A fourth ex-employee dubbed Foundry a “super-charged filing cabinet.” While all of these descriptions are technically accurate, they could also apply to products from hundreds of other tech companies. So what sets Palantir apart?
Part of the answer may lie in Palantir’s marketing strategy. Pinto says he believes that the company, which recently began using the tagline “software that dominates,” has cultivated its mysterious public image on purpose. Unlike consumer-facing startups that need to clearly explain their products to everyday users, Palantir’s main audience is sprawling government agencies and Fortune 500 companies.
What it’s ultimately selling them is not just software, but the idea of a seamless, almost magical solution to complex problems. To do that, Palantir often uses the language and aesthetics of warfare, painting itself as a powerful, quasi-military intelligence partner. “Palantir is here to disrupt and make the institutions we partner with the very best in the world,” Palantir CEO Alexander Karp says in a February 2025 earnings call, “And when it’s necessary, to scare enemies, and on occasion, kill them.”…
… Underneath the jargon and marketing, Palantir sells tools that its customers—corporations, nonprofits, government agencies—use to sort through data. What makes Palantir different from other tech companies is the scale and scope of its products. Its pitch to potential customers is that they can buy one system and use it to replace perhaps a dozen other dashboards and programs, according to a 2022 analysis of Palantir’s offerings published by blogger and data engineer Ben Rogojan.
Crucially, Palantir doesn’t reorganize a company’s bins and pipes, so to speak, meaning it doesn’t change how data is collected or how it moves through the guts of an organization. Instead, its software sits on top of a customer’s messy systems and allows them to integrate and analyze data without needing to fix the underlying architecture. In some ways, it’s a technical band-aid. In theory, this makes Palantir particularly well suited for government agencies that may use state-of-the-art software cobbled together with programming languages dating back to the 1960s.
Palantir began gaining steam in the 2010s, a decade when corporate business discourse was dominated by the rise of “Big Data.” Hundreds of tech startups popped up promising to disrupt the market by leveraging information that was now readily available thanks to smartphones and internet-connected sensors, including everything from global shipping patterns to the social media habits of college students. The hype around Big Data put pressure on companies, especially legacy brands without sophisticated technical know-how, to upgrade their software, or else risk looking like dinosaurs to their customers and investors.
But it’s not exactly easy or cheap to upgrade computer systems that may date back years, or even decades. Rather than tearing everything down and building anew, companies may want a solution designed to be slapped on top of what they already have. That’s where Palantir comes in.
Palantir’s software is designed with nontechnical users in mind. Rather than relying on specialized technical teams to parse and analyze data, Palantir allows people across an organization to get insights, sometimes without writing a single line of code. All they need to do is log into one of Palantir’s two primary platforms: Foundry, for commercial users, or Gotham, for law enforcement and government users…
… Since leaving Palantir, Pinto says he’s spent a lot of time reflecting on the company’s ability to parse and connect vast amounts of data. He’s now deeply worried that an authoritarian state could use this power to “tell any narrative they want” about, say, immigrants or dissidents it may be seeking to arrest or deport. He says that software like Palantir’s doesn’t eliminate human bias.
People are the ones that choose how to work with data, what questions to ask about it, and what conclusions to draw. Their choices could have positive outcomes, like ensuring enough Covid-19 vaccines are delivered to vulnerable areas. They could also have devastating ones, like launching a deadly airstrike, or deporting someone.
In some ways, Palantir can be seen as an amplifier of people’s intentions and biases. It helps them make evermore precise and intentional decisions, for better or for worse. But this may not always be obvious to Palantir’s users. They may only experience a sophisticated platform, sold to them using the vocabulary of warfare and hegemony. It may feel as if objective conclusions are flowing naturally from the data. When Gotham users connect disparate pieces of information about a person, it could seem like they are reading their whole life story, rather than just a slice of it.
“It’s a really powerful tool,” says one former Palantir employee. “And when it’s in the wrong hands, it can be really dangerous. And I think people should be really scared about it.”
“What Does Palantir Actually Do?” from @carolinehaskins.bsky.social in @wired.com.
See also: “Decoding Palantir, the Most Mysterious Company in Silicon Valley.”
And by way of context: “TESCREAL“
* Palantir blog post (linked above)
###
As we bow to Big Brother, we might note that it was on this date in 1981 that the Winklevoss twins, Cameron and Tyler, were born. As famously dramatized in The Social Network, the twins enlisted Harvard College classmate Mark Zuckerberg to help them with a social network project, but Zuckerberg peeled away, with the project that became Facebook. The Winklevosses agreed to a settlement (of $20 million cash and more than a million Facebook shares ), but then sued, claiming that Zuckerberg had misled them about the value of the shares (and that they were entitled to four times as many). After years of litigation, the agreement stood.
But the twins were not solely engaged in litigation. Starting with the cash stake in the original settlement, they went long on cryptocurrency, starting Winklevoss Capital Management (which invests across several asset classes, but heavily in Bitcoin and other cryptocurrencies) and Gemini (a cryptocurrency exchange). They have become major supporters of pro-cryto Republicans in general, and of Donald Trump in particular… which, one notes seems to be earning a return.

“Any chart, no matter how well designed, will mislead us if we don’t pay attention to it. The world cannot be understood without numbers. And it cannot be understood with numbers alone.”*…
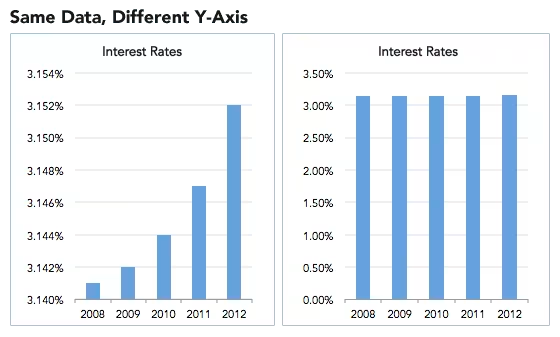
Spencer Greenberg on the critical importance of thinking critically about the charts and graphs that we constantly consume…
In 1994, the U.S. Congress passed the largest crime bill in U.S. history, called the Violent Crime Control and Law Enforcement Act. The bill allocated billions of dollars to build more prisons and hire 100,000 new police officers, among other things. In the years following the bill’s passage, violent crime rates in the U.S. dropped drastically, from around 750 offenses per 100,000 people in 1990 to under 400 in 2018.
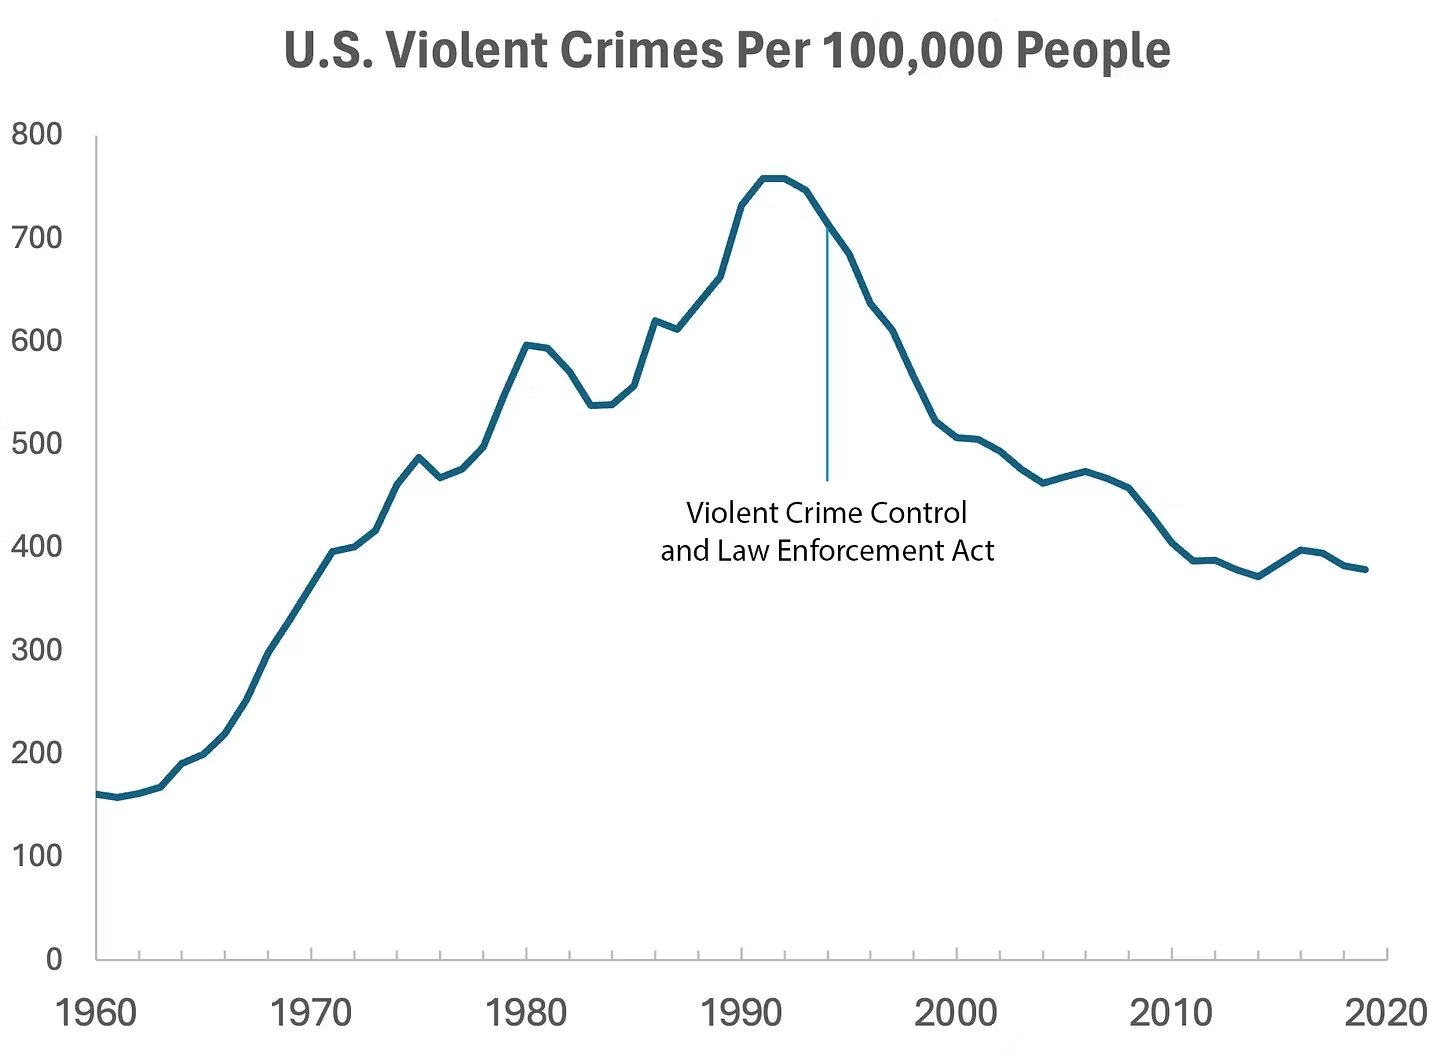
But can we infer, as this chart seems to ask us to, that the bill caused the drop in crime?
As it turns out, this chart wasn’t put together by sociologists or political scientists who’ve studied violent crime. Rather, we—a mathematician and a writer—devised it to make a point: Although charts seem to reflect reality, they often convey narratives that are misleading or entirely false.
Upon seeing that violent crime dipped after 1990, we looked up major events that happened right around that time—selecting one, the 1994 Crime Bill, and slapping it on the graph. There are other events we could have stuck on the graph just as easily that would likely have invited you to construct a completely different causal story. In other words, the bill and the data in the graph are real, but the story is manufactured.
Perhaps the 1994 Crime Bill really did cause the drop in violent crime, or perhaps the causality goes the other way: the spike in violent crime motivated politicians to pass the act in the first place. (Note that the act was passed slightly after the violent crime rate peaked!)
Charts are a concise way not only to show data but also to tell a story. Such stories, however, reflect the interpretations of a chart’s creators and are often accepted by the viewer without skepticism. As Noah Smith and many others have argued, charts contain hidden assumptions that can drastically change the story they tell.
This has important consequences for science, which, in its ideal form, attempts to report findings as objectively as possible. When a single chart can be the explanatory linchpin for years of scientific effort, unveiling a data visualization’s hidden assumptions becomes an essential skill for determining what’s really true. As physicist Richard Feynman once said: In science, “the first principle is that you must not fool yourself, and you are the easiest person to fool.”What we mean to say is—don’t be fooled by charts…
[Greenberg unpacks a couple of powerful examples…]
… to avoid producing a chart that misleads scientists, which misleads journalists, which misleads the public, and which then contributes to widespread confusion, you must think carefully about what you actually aim to measure. Which representation of the data best reflects the question being asked and relies on the sturdiest assumptions?
After all, scientific charts are a means to read data rather than an explanation of how that data is collected. The explanation comes from a careful reading of methods, parameters, definitions, and good epistemic practices like interrogating where data comes from and what could be motivating the researchers who produced it.
In the end, the story a chart tells is still just that—a story—and to be a discerning reader, you must reveal and interrogate the assumptions that steer those narratives…
Eminently worth reading in full: “How charts can inadvertently manipulate reality,” from @spencrgreenberg.bsky.social.
* Alberto Cairo, How Charts Lie: Getting Smarter about Visual Information
###
As we ferret out the facts, we might recall that it was on this date in 1874 that Florence Nightingale became the first female President of the Royal Statistical Society.
Famed for her work as a nurse in the Crimean War, she went on to found training facilities and nursing homes– pioneering both medical training for women and what is now known as Social Entrepreneuring. Less well-known are Nightingale’s contributions to epidemiology, statistics, and the visual communication of data in the field of public health. Always good at math, she pioneered the use of the polar area chart (the equivalent to a modern circular histogram or rose diagram) and popularized the pie chart (which had been developed in 1801 by William Playfair). Nightingale later became an honorary member of the American Statistical Association.

“Diagram of the causes of mortality in the army in the East” by Florence Nightingale, an example of the the polar area diagram (AKA, the Nightingale rose diagram) source

“It is a capital mistake to theorize before one has data”*…

The estimable Claudia Sahm on what the elimination of an obscure advisory committee on economic data says about the administration’s commitment to relevance and accuracy…
In a time of great economic uncertainty, President Donald Trump’s administration quietly took a step last week that could create even more: Secretary of Commerce Howard Lutnick disbanded the Federal Economic Statistics Advisory Committee.
I realize that the shuttering of an obscure statistical advisory committee may not strike anyone as a scandal, much less an outrage. But as an economist who has presented to the committee, known as FESAC, I know how it improved the information used by both the federal government and private enterprise to make economic decisions. Most Americans do not realize how many aspects of their lives rely on timely and accurate government data.
One of FESAC’s official responsibilities was “exploring ways to enhance the agencies’ economic indicators to make them timelier, more accurate, and more specific to meeting changing demands and future data needs.” In the complex and highly dynamic US economy, this is an ongoing effort — not a one-time task that has been “fulfilled,” which was the Commerce Department’s stated reason for terminating the committee.
The 15 members of the advisory committee, who were unpaid, brought deep technical expertise on economic measurement from the private sector, academia and the non-profit world. They were a sounding board for the Census Bureau, Bureau of Labor Statistics, and Bureau of Economic Analysis, which produce much of the nation’s official statistics.
If statistics fail to keep up with the changing economy, they lose their usefulness. When the committee last met in December, one focus was on measuring the use and production of artificial intelligence. Staff from the agencies shared existing findings on AI, such as from the Business Trends and Outlook Survey that began in 2022, and outlined new data collection efforts. AI’s current use among businesses has nearly doubled since late 2023, and even more businesses expect to adopt AI in the next six months.
The committee was asked what data products would be most useful. Expert feedback, including a request to harmonize the definitions of AI across surveys and align with cutting-edge research, is especially valuable at the early stages of data collection. The growth and employment effects of AI are among the most pressing questions facing the economy, and external experts are crucial to supporting the creation of high-quality data.
Enhancing official economic statistics under budget constraints often requires creative approaches. At its meeting last June, the committee discussed using private-sector data to create statistics on regional employment and other outcomes. There is considerable demand among businesses and local governments to have timely geographic detail, but it is cost-prohibitive with current government surveys. Members of FESAC, some of whom work at companies like Indeed and JP Morgan Chase, offered first-hand knowledge of the pros and cons of using private-sector data.
The committee contributed far more than just twice-a-year meetings. It also created relationships with the private sector that government agencies could draw on as part of their continuing effort to improve their statistics.
The National Academies of Sciences, in discussing best practices for statistical agencies, argues that external advisory committees are a good way to engage with users of the data and obtain expert advice. Moreover, external evaluation should be part of regular program reviews to ensure quality, relevance and cost-effectiveness. That’s exactly what FESAC did.
The statistical agencies need more, not fewer, resources now to meet their challenges. During the campaign, Trump repeatedly questioned the credibility of US employment statistics. In particular, he claimed that the downward revisions of monthly payrolls showed political interference. Senators Bill Cassidy and Susan Collins asked the Bureau of Labor Statistics to explain why large revisions were happening and how to avoid them. FESAC could have been a valuable resource for possible improvements.
Disbanding FESAC does not advance the administration’s goal of greater efficiency in the government. In 2024, the committee’s cost was expected to be a modest $120,000, covering travel expenses and minimal staff support. Virtual-only meetings could have reduced those costs still further, if that was a concern. Regardless, the benefits to the millions of data users from regular reviews by external experts far exceed that negligible cost.
Putting a low-cost, high-value committee on the chopping block does not bode well for other investments in the official statistics. Reductions in staff and budget would likely degrade the quality of the official statistics. Even before Trump took office, all three agencies operated in a tight budget environment.
Reduced transparency in official statistics is perhaps the most troubling aspect of disbanding FESAC. Cutting off agency staff from external advisers creates an environment where political interference could occur much more easily — and go undetected. With political officials such as Lutnick arguing publicly that GDP should exclude government spending, it is especially important to have external, independent experts.
And FESAC is not alone. By executive order, the administration is ending several advisory committees in the federal government, reducing transparency and the technical resources for agencies. It’s a short-sighted approach that could undermine essential government services…
“The War on Government Statistics Has Quietly Begun” (gift link) from @claudia-sahm.bsky.social in @bloomberg.com.
Apposite: “The True Cost of Trump’s Cuts to NOAA and NASA,” “Trump’s shocking purge of public health data, explained,” and “Trump USDA Sued for Erasing Webpages Vital to Farmers“… and so many– too many– others.
(Image above: source… note how many of the data sources cited are are precisely the sorts of government resources being targeted)
* Sherlock Holmes (Arthur Conan Doyle)
###
As we drive with our windows painted over, we might send understanding birthday greetings to Robert Heilbroner; he was born on this date in 1919. An economist and historian of economic thought, he was the author of some two dozen books, the best known of which is The Worldly Philosophers: The Lives, Times and Ideas of the Great Economic Thinkers (1953), a remarkable survey of the lives and contributions of famous economists (perhaps most notably Adam Smith, Karl Marx, and John Maynard Keynes). Your correspondent can also recommend The Future as History (1960).
Heilbroner was considered highly unconventional by those in his field; indeed, he regarded himself a social theorist and “worldly philosopher” (philosopher pre-occupied with “worldly” affairs, such as economic structures) and tended to integrate the disciplines of history, economics, and philosophy into his work. Nonetheless, Heilbroner was recognized by his peers as a prominent economist and was elected vice president of the American Economic Association in 1972.

You must be logged in to post a comment.