Posts Tagged ‘satellites’
“Those who first invented and then named the constellations were storytellers. What it changed was the way people read the night sky.”*…
Scheduling Note: (Roughly) Daily will be off tomorrow, but should return on Saturday…
Astronomers, photographers, and star gazers in general have been living with (that’s to say, looking for out-of-the-way locations in order to avoid) light pollution for over a century. But of late, they’ve been grappling with a newer challenge: bright satellites that stand, like grafitti, between observers — no matter how remote — and the treasures of the night sky.
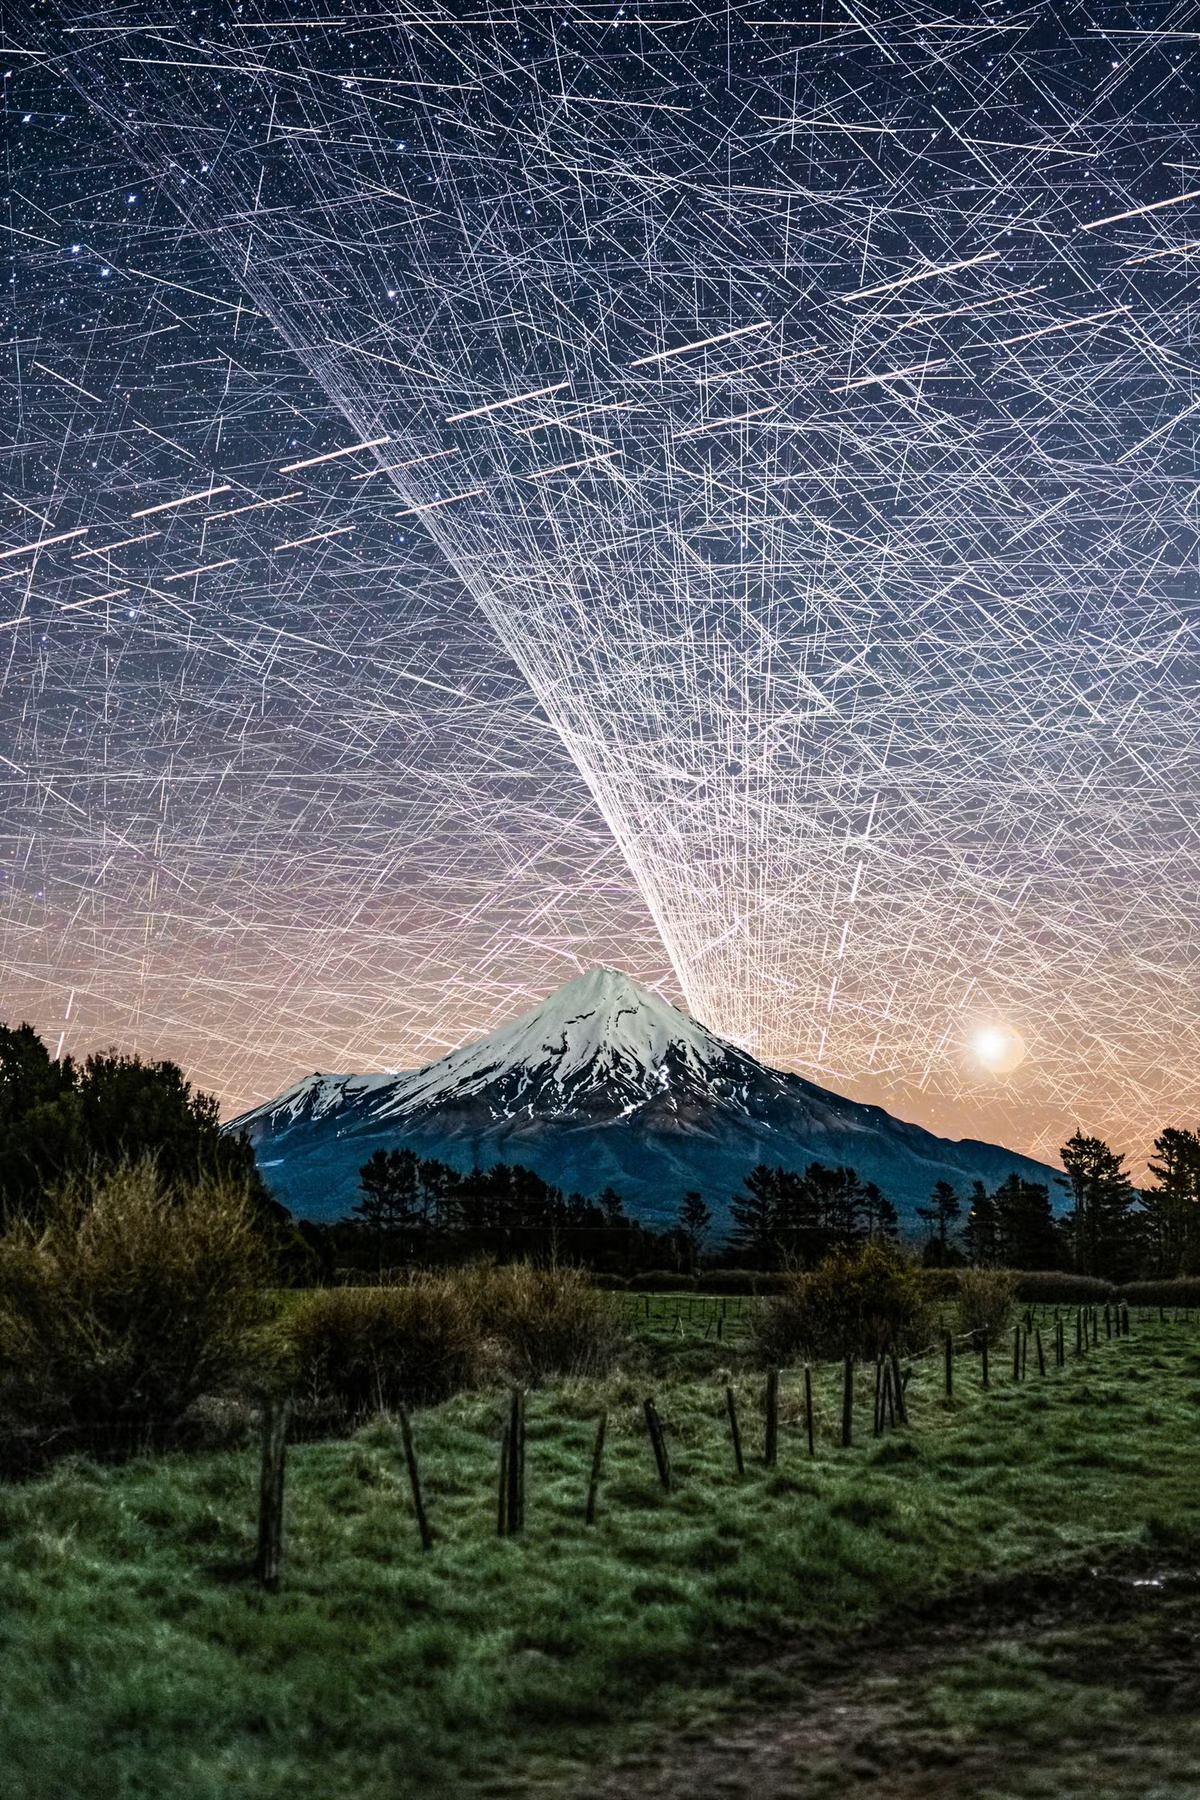
Photographer Brendan Larsen created a striking demonstration, as Kottke.org reports..
To create this composite image [and as above], photographer Brendan Larsen captured almost 600 photographs over a two-hour period and then manually stitched them together.
This is the most time-consuming photo edit I’ve EVER done!
I left my camera photographing the night sky over Mt Taranaki [see here] for nearly TWO HOURS, capturing 578 photographs.
The result? An estimated 14,450 satellite trail appearances, representing approximately 1,400 individual satellites! 😱
I manually masked in EVERY SINGLE TRAIL from the original photographs — approximately 45 HOURS of editing to create this one image!
The Guardian has more on how he created the image (which, despite many online commenters’ beliefs, is not AI):
Larsen, 51, says he set his camera up to take an unlimited number of eight-second-long shots, with a two-second gap in between each photo. “I left her running for two hours and captured 578 photos … That was the easy part.”
The hard part came next. Larsen spent about 45 hours layering the individual photos – each of which contained about 25 satellites – over one another, using Adobe Photoshop. Much of the time was spent painstakingly erasing stars, to reveal the satellites.
“I could start to see the pattern emerging and realised: ‘Wow, this looks really awesome.’ I knew if I carried on it would look even better and more impressive in terms of satellite numbers.” [source article]
Fellow photographer Vincent Laforet called Larsen’s image “an important photograph”:
I was initially startled. Then confused. Then fascinated all in quick succession.
And then I felt a deep sense of betrayal once I realized that what I was tracking with my eyes were a series of small satellites. And btw: that they likely had ruined my long exposure that I was capturing at the time.
I remember asking in the moment:
Who gave anyone permission do this?
What’s between us and the stars: “Stunning Image of Our Satellite-Choked Night Skies,” from @kottke.org.
###
As we search the skies, we might send far-sighted birthday greetings to Audouin Dollfus; he was born on this date in 1924. An astronomer and aeronaut, he was the successor to Bernard Lyot as the principal French authority on the solar system; Dollfus discovered Janus, a moon of Saturn.
While Dollfus made use of terrestrial telescopes, he was creative in finding a way past the challenges of light pollution and closer to the objects of his study. With his father (the aeronautical pioneer Charles Dollfus), he holds several world records in ballooning, including the first stratospheric flight in France. He was the first to carry out astronomical observations from a stratospheric balloon, in particular to study Mars in a detailed way.
The asteroid 2451 Dollfus is named in his honor, and one of the largest craters on Mars was also named for him.


“Without data, you’re just another person with an opinion”*…

… and that data can be even more useful if we can visualize it. Andrew Zolli introduces a new opportunity…
Whether we’re contending with food shocks, responding to disasters, preventing the next pandemic, helping communities adapt to a changing climate, or just delivering basic governmental services, one constant runs through it all: people. Where we live, how we move, when we gather or flee – these human patterns shape the arc of every modern challenge. Without a deep and dynamic understanding of those patterns, meaningful action becomes not just harder, it becomes guesswork.
That’s why I’m so excited about our ongoing collaboration with colleagues at the Microsoft AI for Good Lab and the Institute for Health Metrics and Evaluation to develop the world’s most up-to-date, highly accurate, high resolution #population density maps. Harnessing the power of Planet’s high-frequency, high-resolution satellite imagery, the AI for Good team’s artificial intelligence expertise, and IHME’s deep demographic modeling capabilities, these population maps allow us to estimate how many people we’re likely to find in every 40 sq meter patch of Earth, in every country of the world. And because the underlying data is updated quarterly, they also allow us to see change over time.
This week, we announced the completion of the first phase of this work at the United Nations AI For Good Global Summit, held in Geneva. We’ve been piloting the use of these population maps as part of the UN’s Early Warnings For All Initiative, which seeks to ensure that everyone on Earth is protected from hazardous weather, water, and climate events. In an early use-case, by overlaying population data with maps of mobile connectivity, we’ve been able to identify unconnected populations that might not be reachable in a crisis.
And that’s just one of what are likely hundreds – even thousands – of ways this kind of population data can be put to work. Knowing where people are settling, and how those patterns are changing, is foundational to everything from public health campaigns to the design of infrastructure and services. If we want to reduce wildfire risk, for example, we need to understand where human communities are pressing into forested frontiers. If we want to evacuate people ahead of an oncoming storm, we need to know how many lives are in harm’s way. And if we want to ensure people aren’t displaced by unlivable heat, we have to overlay human presence with climate exposure.
You can learn more and sign up to explore a coarser (but compelling!) (40km/pixel) visualization of the population data. At the AI for Good Summit, we also announced an Early Access Program for a carefully selected number of trusted organizations who will explore applications of the data and give feedback. If that sounds like it might be of interest, please contact services@healthdata.org…
A new tool for visualizing the world in which we live: “Everyone, Everywhere: Mapping Humanity’s Changing Footprint in Unprecedented Detail,” from @andrewzolli.bsky.social and his collegues at Planet.
###
As we get down with data, we might spare a thought for a spiritual ancestor of Planet’s, Denis Diderot; he died on this date in 1784. A philosopher, art critic, and writer, he is best known for serving as co-founder, chief editor, and contributor to the Encyclopédie along with Jean le Rond d’Alembert.
The Encyclopédie is most famous for representing the thought of the Enlightenment. According to Denis Diderot in the article “Encyclopédie”, the Encyclopédie‘s aim was “to change the way people think” and for people to be able to inform themselves and to know things. He and the other contributors advocated for the secularization of learning away from the Jesuits. Diderot wanted to incorporate all of the world’s knowledge into the Encyclopédie and hoped that the text could disseminate all this information to the public and future generations. Thus, it is an example of democratization of knowledge.
It was also the first encyclopedia to include contributions from many named contributors, and it was the first general encyclopedia to describe the mechanical arts. In the first publication, seventeen folio volumes were accompanied by detailed engravings. Later volumes were published without the engravings, in order to better reach a wide audience within Europe…
– source

“Round and round she goes, where she stops, nobody knows”*…

Low Earth Orbit Satellites are objects that orbit the earth at lower altitudes than geosynchronous satellites, usually at between 160 km and 1000 km above the earth. They’re primarily used for imaging (think Google Maps/Earth, military reconnaissance, spying, and the like) or communications (signal relay, a la Starlink‘s new satellite internet service).
Even as there are concerns about the proliferation of objects in the sky at that altitude– ranging from the occlusion of the view into space through privacy to the accumulating layer of junk that defunct satellites could become— the rush to launch is on.
Leo Labs (@LeoLabs_Space) is a platform that aims to support developers and operators of LEOs. They provide a handy (and mesmerizing) real-time visualization of all of the LEOs aloft.
* a recurring line on Major Bowes Original Amateur Hour, a radio show that aired from 1934-1948 (then became Ted Mack Original Amateur Hour on television).
###
As we look up, we might recall that it was on this date in 1962 that President John F. Kennedy (and Vice-President Lyndon B. Johnson) visited newly-minted American hero John Glenn at Cape Canaveral to congratulate Glenn on becoming the first American to orbit the earth. Piloting Friendship 7, he had orbited the earth three times before splashing down in the Atlantic.

You must be logged in to post a comment.