Posts Tagged ‘Saturn’
“Those who first invented and then named the constellations were storytellers. What it changed was the way people read the night sky.”*…
Scheduling Note: (Roughly) Daily will be off tomorrow, but should return on Saturday…
Astronomers, photographers, and star gazers in general have been living with (that’s to say, looking for out-of-the-way locations in order to avoid) light pollution for over a century. But of late, they’ve been grappling with a newer challenge: bright satellites that stand, like grafitti, between observers — no matter how remote — and the treasures of the night sky.
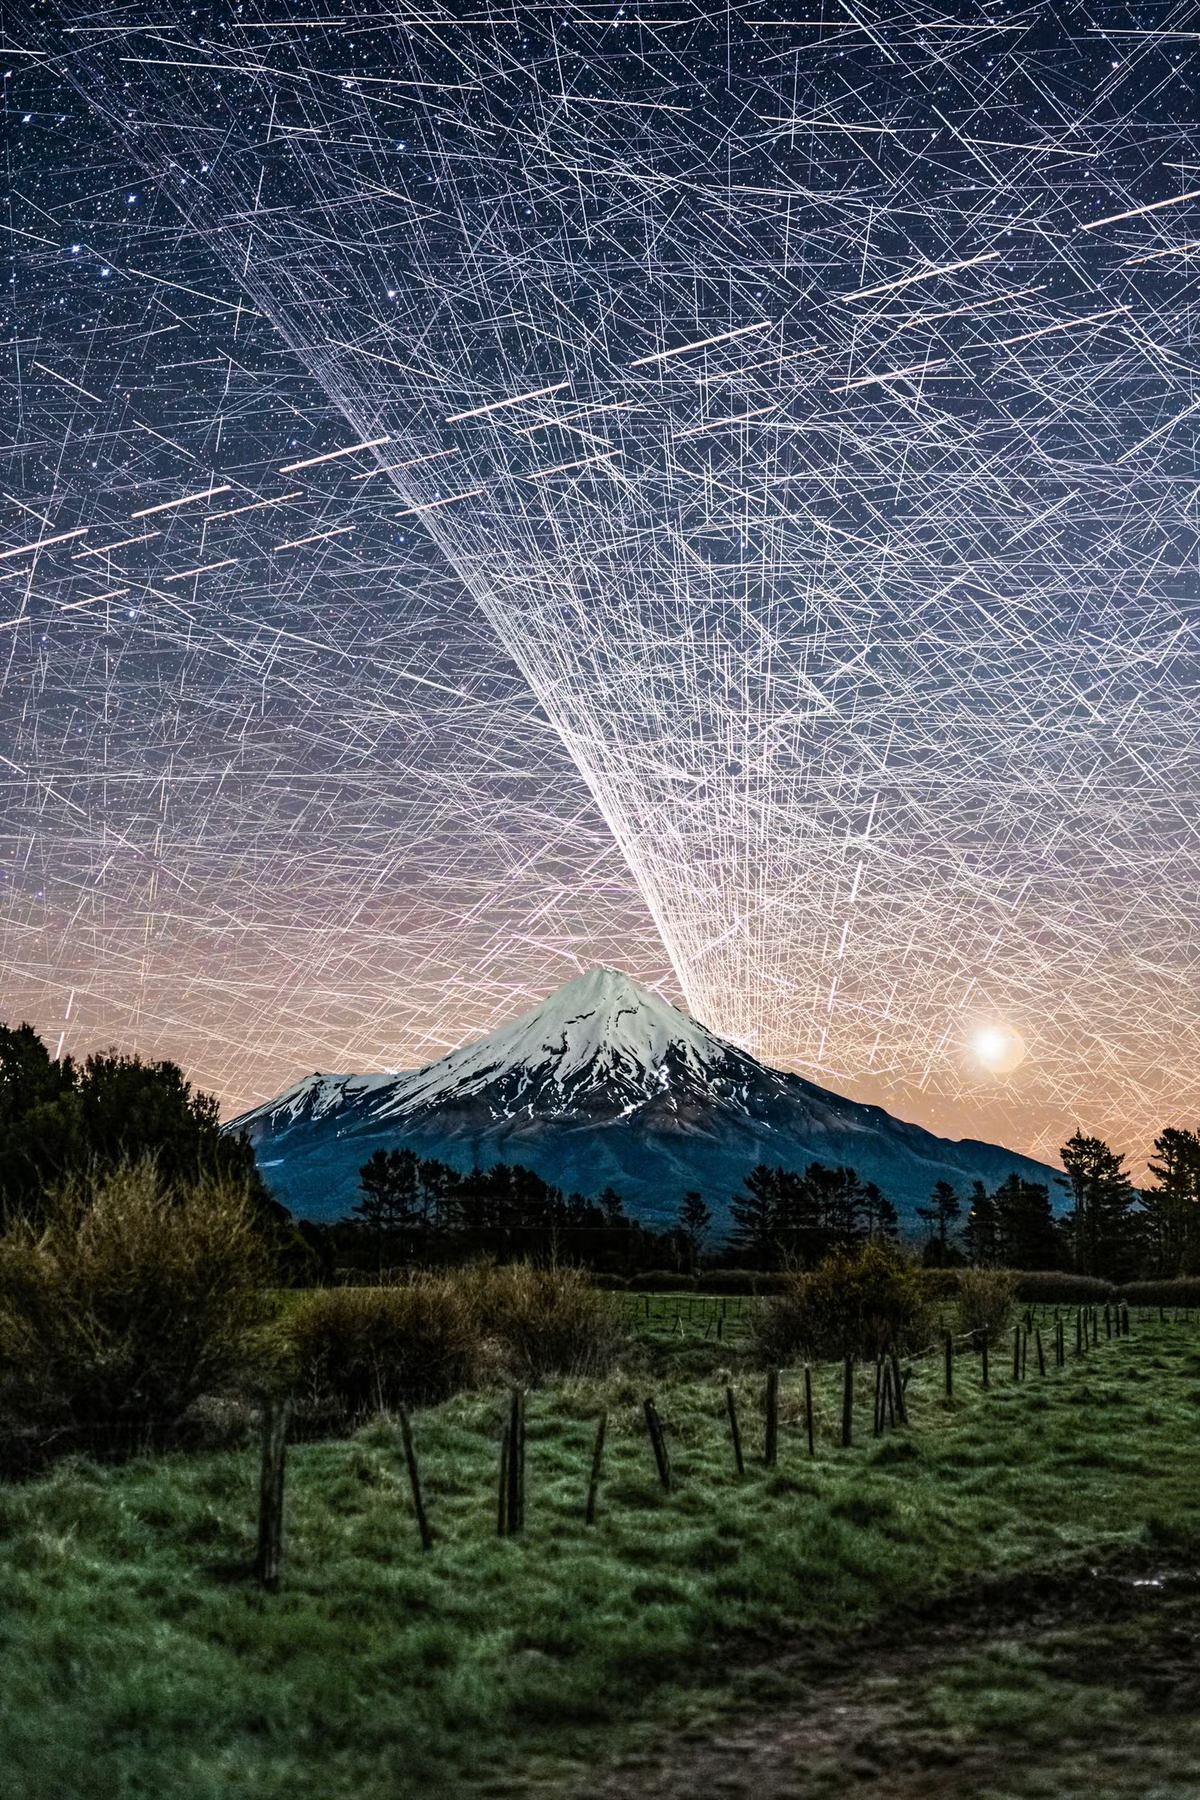
Photographer Brendan Larsen created a striking demonstration, as Kottke.org reports..
To create this composite image [and as above], photographer Brendan Larsen captured almost 600 photographs over a two-hour period and then manually stitched them together.
This is the most time-consuming photo edit I’ve EVER done!
I left my camera photographing the night sky over Mt Taranaki [see here] for nearly TWO HOURS, capturing 578 photographs.
The result? An estimated 14,450 satellite trail appearances, representing approximately 1,400 individual satellites! 😱
I manually masked in EVERY SINGLE TRAIL from the original photographs — approximately 45 HOURS of editing to create this one image!
The Guardian has more on how he created the image (which, despite many online commenters’ beliefs, is not AI):
Larsen, 51, says he set his camera up to take an unlimited number of eight-second-long shots, with a two-second gap in between each photo. “I left her running for two hours and captured 578 photos … That was the easy part.”
The hard part came next. Larsen spent about 45 hours layering the individual photos – each of which contained about 25 satellites – over one another, using Adobe Photoshop. Much of the time was spent painstakingly erasing stars, to reveal the satellites.
“I could start to see the pattern emerging and realised: ‘Wow, this looks really awesome.’ I knew if I carried on it would look even better and more impressive in terms of satellite numbers.” [source article]
Fellow photographer Vincent Laforet called Larsen’s image “an important photograph”:
I was initially startled. Then confused. Then fascinated all in quick succession.
And then I felt a deep sense of betrayal once I realized that what I was tracking with my eyes were a series of small satellites. And btw: that they likely had ruined my long exposure that I was capturing at the time.
I remember asking in the moment:
Who gave anyone permission do this?
What’s between us and the stars: “Stunning Image of Our Satellite-Choked Night Skies,” from @kottke.org.
###
As we search the skies, we might send far-sighted birthday greetings to Audouin Dollfus; he was born on this date in 1924. An astronomer and aeronaut, he was the successor to Bernard Lyot as the principal French authority on the solar system; Dollfus discovered Janus, a moon of Saturn.
While Dollfus made use of terrestrial telescopes, he was creative in finding a way past the challenges of light pollution and closer to the objects of his study. With his father (the aeronautical pioneer Charles Dollfus), he holds several world records in ballooning, including the first stratospheric flight in France. He was the first to carry out astronomical observations from a stratospheric balloon, in particular to study Mars in a detailed way.
The asteroid 2451 Dollfus is named in his honor, and one of the largest craters on Mars was also named for him.


Pictures worth a million words…
 In his great opus De Revolutionibus Orbium Coelestium published shortly before his death in 1543, Copernicus takes 405 pages of words, numbers and equations to explain his heliocentric theory. But it is the diagram that he draws at the beginning of the book that captures in a simple image his revolutionary new idea: it is the Sun that is at the centre of the Solar System, not the Earth.
 A diagram has the power to create a whole new visual language to navigate a scientific idea. Isaac Newton’s optics diagrams [Opticks, 1704] for example transform light into geometry. By representing light as lines, Newton is able to use mathematics and geometry to predict the behaviour of light. It was a revolutionary idea.
 Mathematicians had been struggling with the idea of the square root of minus one. There seemed to be no number on the number line whose square was negative. Experts knew that if such a number existed it would transform their subject. But where was this number? It was a picture drawn independently by three mathematicians at the beginning of the 19th Century that brought these numbers to life. Called the Argand diagram after one of its creators, this picture… was a potent tool in manipulating these new numbers [Imaginary Numbers] since the geometry of the diagram reflected the underlying algebra of the numbers they depicted.
 Although better known for her contributions to nursing, Florence Nightingale’s greatest achievements were mathematical. She was the first to use the idea of a pie chart to represent data. Nightingale’s diagrams were designed to highlight deaths in the Crimea. She had discovered that the majority of deaths in the Crimea were due to poor sanitation rather than casualties in battle. She wanted to persuade government of the need for better hygiene in hospitals. She realised though that just looking at the numbers was unlikely to impress ministers. But once those numbers were translated into a picture – her “Diagram of the Causes of Mortality in the Army in the East” – the message could not be ignored.
Read more (and find links to enlarged versions of the images above) at BBC.com, in “Diagrams that Changed the World,” a teaser for new BBC TV series, Marcus du Sautoy’s six-part The Beauty of Diagrams (on air now, and available via iPlayer to readers in the U.K… and readers with VPNs that can terminate in the U.K.)
As we marvel at the power of pictures, we might recall that it was on this date in 1997 that eight planets in our Solar System lined up from West to East– beginning with Pluto, followed by Mercury, Mars, Venus, Uranus, Neptune, Saturn and Jupiter, with a crescent moon alongside– in a rare alignment visible from Earth. Mercury, Mars, Venus, Jupiter and Saturn were visible to the naked eye; the small blue dots that are Uranus and Neptune, with binoculars. Pluto was visible only by telescope (but has subsequently been demoted from “planet” anyway…). The planets also aligned in May 2000, but too close to the sun to be visible from Earth.
Readers who missed it have a long wait for the reprise: it will be at least another 100 years before so many planets will be so close and so visible.

You must be logged in to post a comment.