Posts Tagged ‘global economy’
“Let’s go to the numbers”*…

From the McKinsey Global Institute, the executive summary of their snapshot– a “balance sheet”– of the global economy…
• The global balance sheet takes stock of all assets, liabilities, and wealth, providing a lens into economic health. This annual update estimates that it reached nearly $1.8 quadrillion ($1,800 trillion) in 2025, up from $1.7 quadrillion in 2024. Several asset classes grew further out of balance with the underlying economy, raising the possibility of corrections through inflation, asset valuation losses, or, optimally, productivity growth.
• The balance sheet’s mounting detachment from the global economy was driven by the world’s two biggest economies in 2025. US equity values soared to 2.4 times corporate net assets as profits were double their share of GDP since 2000. China’s corporate debt grew to 80 percent of real assets, versus 50 percent globally. Government debt remains near all-time highs in the United States and has grown most rapidly in China.
• Globally, most corporate and household debt and real estate moved closer to 25-year averages relative to GDP. Inflation helped with this normalization, although values remain well above pre-2000 levels. The ratio of productive assets to GDP held steady amid flat investment.
• Global household wealth growth rose to a new high of $570 trillion, driven by “paper” gains. Only 20 percent came from real capital formation, while valuations of existing assets grew four percentage points faster than already-high consumer price inflation. In the United States and Canada, equity values drove wealth growth. China, France, and Germany saw a drop in paper wealth as real estate prices declined. In the United Kingdom and Japan, inflation pushed up asset values.
• Major economies were on different pathways entering 2026. The United States has been in a “productivity acceleration” scenario, but high public debt and equities add the possibility of “sustained inflation” or “balance sheet reset.” Europe has gravitated toward “secular stagnation” as sluggish demand depresses growth and interest rates. China has experienced a partial balance sheet reset amid declining property values, although government spending and corporate investment have continued to propel balance sheet growth.
In this report, we provide an update on the global balance sheet in 2025, exploring to what extent its recent expansion, and by extension wealth growth, has been “in balance.” The analysis finds that wealth was, to an even greater extent than previously, rooted in asset values rising faster than real economy investment and growth, creating record levels of global wealth “on paper.”
Although many economies that were studied experienced wealth and balance sheet swings, the global picture was largely driven by its two biggest: the United States and China. Higher US equity values and the accumulation of China’s public and private debt brought some near-term economic benefits but left their economies more vulnerable to potential corrections.
Businesses use both income statements and balance sheets to develop a complete picture of their financial health. Analysts of the global economy tend to focus on the former. Since 2021, MGI has developed a “global balance sheet” to fill this gap, representing a clearer view into the world economy’s wealth and health.
Our previous reports found that from the mid-1990s to the COVID-19 pandemic, household wealth expanded faster than gross domestic product. Asset prices for real estate, equities, and bonds grew, as did debt and deposits. This occurred amid declining (and eventually rock-bottom) interest rates, rapidly expanding US profits, and a property boom in China. Productivity did not keep pace across advanced economies, nor did real wealth formation through net new investment.
When the balance sheet outruns the underlying economy, weaknesses can be exposed. When real estate and equity values rise faster than GDP, capital may disproportionately go to asset repurchases, sometimes with a lot of leverage. This may push up valuations but leave the economy deprived of the type of investment that generates long-run growth. For households, wealth rises but merely on paper, with heightened risks of eventual corrections. Growing asset values also tend to exacerbate wealth inequality, as existing owners of wealth see large gains while entering asset markets becomes harder for others (for example, young households trying to buy a home).
Elevated balance sheets may correct in one of three ways. A productivity acceleration scenario involves higher income supporting high asset values and debt; this is the most preferred outcome. A sustained inflation scenario brings down the real values of assets and debt, recalibrating the balance sheet with higher nominal GDP. But it can erode inflation-adjusted wealth along with other undesirable side effects. A balance sheet reset scenario, entailing a drop in asset values, deleveraging, and defaults, would shrink the balance sheet in absolute terms, with severe wealth losses and, often, lengthy periods of lost economic growth. Or the balance sheet may just stay high, particularly under secular-stagnation-like conditions of low investment and interest rates, as seen in the United States and Europe in the 2010s. That’s seemingly good for wealth, but at the cost of low growth and rising leverage.
Historically, most balance sheet corrections have taken place through higher inflation. Indeed, the inflation coming out of the COVID-19 pandemic in the United States and Europe brought a correction in the balance sheet (and wealth) ratio to GDP. In China, a drop in property values drove a decline in wealth to GDP.
In 2025, global wealth reached a higher dollar value than ever before. But how “healthy” was this new growth? After postpandemic corrections, some balance sheet items have resumed expansion and reached new heights. This was particularly the case for US equity as AI fueled market optimism and corporate earnings continued to climb. Rising government debt relative to GDP remains a challenge in many economies amid higher interest rates. Stocks of currency and deposits remain high compared to longer-term historical norms. Altogether, this has culminated in even more wealth on paper than in the past several decades and raises the stakes for US corporate earnings to deliver.
Balance sheets, and macroeconomic factors like productivity and inflation, point to diverging trends across major economies. Recognizing the swing factors that can shift an economy to productivity acceleration is more urgent than ever: for the United States, corporate earnings and greater government saving (in other words, less borrowing); for Europe, greater investment; for China, higher domestic consumption.
Future global wealth and stability may depend on it…
[The report unpacks 0with lots of charts/data) the contents– the constituent elements– of the balance sheet, examines whether or not it is “in balance,” and considers whether the growth that it reflects has been “healthy.” (McKinsey worries that it has not been.) It concludes, addressing the executives who are McKinsey’s primary clients…]
… A balance sheet that is out of kilter with the economy—in other words, with high paper wealth fueled by debt and liquidity levels significantly above historical norms—can unwind via higher productivity, higher inflation, or asset price corrections. Balance sheets may also remain large, typically under secular-stagnation-like conditions, effectively kicking the can down the road for potential correction.
Each of these four scenarios shapes the long-term economic outlook. Only productivity acceleration delivers real economic growth justifying valuations, thus protecting wealth. The others sacrifice wealth, growth, or both. Sustained inflation reduces real values of wealth, secular stagnation sees low growth, and a balance sheet reset signals a loss of wealth and growth. Importantly for business leaders, two scenarios would likely mean structurally higher interest rates: Productivity acceleration would entail greater demand for capital amid higher business investment, while sustained inflation would likely involve central banks tightening policy rates and, ultimately, higher long-term yields.
All scenarios are possible for all major economies. However, they appear to be on different pathways, with different swing factors that could move them from one trajectory to another.
For executives, this means both preparing for an unusually broad array of economic pathways and carefully watching the swing factors, which rise above the noise of daily indicators (see sidebar “Business planning for all scenarios”). Leaders across sectors and industries could also explore ways to encourage the optimal outcome, the productivity acceleration scenario.
Major economies show significant divergence in trends across macro drivers of productivity, inflation, and interest rates, along with fundamental balance sheet components including real estate, equity, and debt.
The United States has seen a structural uptick in both productivity growth and interest rates relative to the prepandemic period. Productive investment, particularly driven by the tech sector, has recently grown. High equity values also signal market confidence, although they may pose some downside risks. Meanwhile, inflation remains above the Federal Reserve’s 2 percent target and government debt remains near all-time highs, adding further inflation risk.
The eurozone has experienced a return to secular-stagnation-like conditions, akin to the prepandemic period, amid flat productivity and higher saving. Europe’s balance sheets overall appear more in balance compared to the US balance sheet (with a few exceptions, such as Italy’s government debt). Productivity growth rates, however, are down across the region’s three largest economies (Germany, France, and Italy). Until recently, inflation was mostly trending toward the European Central Bank’s 2 percent target, although Europe is more exposed to energy price changes. Personal savings rates remain high amid a drop in aggregate demand and per capita household wealth has declined in PPP terms in Germany and France.3 Productive investment remains below prepandemic and global averages.
China continues to work through a partial balance sheet reset in the face of a continued decline in real estate, with questions about future growth drivers amid low household demand and a boom in corporate investment. Productivity growth has receded in recent years, although it remains above the rate in advanced economies. Inflation and, in tandem, nominal interest rates have dropped, and concerns have shifted to dealing with deflation risks. At a macro level, lower household property investment has been offset by higher corporate investment, especially among state-owned enterprises, and by government spending. This has coincided with a substantial rise in corporate and government debt, both reaching all-time highs.
While the United States is the only major economy showing signs of productivity acceleration, it is not guaranteed long term, and other economies have a potential path to it. Focusing on “swing factors” could help filter signal from noise in the daily flow of indicators, market fluctuations, and political headlines. These factors differ by economy.
In the United States, swing factors that could knock the economy out of productivity acceleration include the “fiscal tightrope” and corporate earnings.
- Government debt stands at about 120 percent of GDP. Combined with higher interest rates, this means more public spending will need to be directed toward debt repayment. Public spending could come under pressure, especially from bond investors, in the form of higher market interest rates. These translate into higher business costs of capital. If fiscal policy tightens too little, a public debt crisis or sustained inflation becomes more likely. Too much, and secular stagnation is a potential outcome. To bring budgets back into balance, greater fiscal saving (or lower borrowing) on the order of three percentage points of GDP would be needed.
- On the corporate-earnings side, an equity or wealth reset could be triggered by a large structural shift in the longer-term outlook—for example, from AI disappointment or large geopolitical disruption. Equities are at all-time highs, at 3.7 times GDP and 2.4 times net assets, and constitute nearly 40 percent of household wealth. A price correction could result in a sharp pullback in demand, ushering in an extended period of low growth. It is thus imperative that corporate earnings deliver on high expectations…
Eminently worth reading in full: “The global balance sheet 2026: Imbalance and divergence.”
See also: “World Economic Situation and Prospects 2026” from UNCTAD (the UN Trade and Development Organization), whose review of the global finacial situation resonates with McKinsey’s, but whose recommendations are targeted to global policy makers and development champions:
• Strengthen coordination across macroeconomic policies. Monetary policy alone cannot manage persistent price pressures. Better alignment between monetary, fiscal and industrial policies is essential to stabilise inflation, support investment and protect vulnerable groups.
• Use fiscal policy strategically and credibly. Targeted and temporary measures can help protect households from high prices and support social cohesion, while credible medium-term fiscal plans and prudent debt management are essential to rebuild fiscal space.
• Scale up multilateral cooperation and development finance. Implementing commitments under the Sevilla Commitment, including debt reform and expanded concessional and climate finance, is vital to closing investment gaps and reducing systemic risks.
• Reinforce an open, rules-based trading system. Strengthening transparency, predictability and cooperation in global trade remains central to sustaining growth and limiting fragmentation in an increasingly uncertain global economy.
And for a differently-flavored kind of accounting: “What the Big Mac index reveals about a global currency beef.”
* Catchphrase often used by financial and sports journalists to transition to statistics or financial data, e.g., on public radio’s wonderful Marketplace.
###
As we ponder the political economy, we might recall (hoping that history doesn’t repeat itself) that on this date in 1929, while the U.S. economy was already showing signs of strain (agricultural strains and a sagging consumer market), the U.S., its businesses, and its financial markets were still in the “Roaring Twenties.” Roughly three months later (on October 24, 1929, “Black Thursday,” and October 29, 1929, “Black Tuesday”) America– and the world– suffered the Wall Street crash of 1929 and began the slide into the Great Depression.
By this date in 1932, stocks had lost roughly 90% of the value they had had three years earlier. GDP in the U.S. had fallen 30%; GDP around the world was down 15%. International trade fell by more than 50%, and unemployment in some countries rose as high as 33% (peaking in 1933 at 25% in the U.S.).

“The almighty dollar, that great object of universal devotion”*…

The reigning global financial regime, at the center of which sits the U.S. Dollar, was first formalized at the 1944 Bretton Woods Conference. While the rules have evolved since then, the Dollar remains by far the world’s leading reserve currency and is routinely used to price/settle international transactions around the world.
While there are concerns in the U.S. that a strong dollar can hurt U.S. exports and costs jobs, high global demand for dollars allows the United States to borrow money at a lower cost and amplifies the power of its sanctions.
So recent talk of “the decline of the dollar” (c.f., e.g., here) has concerned many. Not to worry, Noah Smith suggests…
Saudi Arabia recently announced that it’s open to settling trade (i.e., oil sales) in currencies other than the U.S. dollar. This has provoked a fair amount of consternation about the potential end of dollar dominance. This fear has been intensified by all the Bitcoin people who are screaming that the banking system is going to collapse and that this is going to spell the end of the U.S. dollar.
In fact, people shouldn’t be concerned at all. I’ve written two posts — one last year and one this February — explaining why A) de-dollarization is extremely unlikely to happen anytime soon, and B) some degree of diversification away from the dollar would actually be good for the United States. Both posts were paywalled, but I decided to unpaywall them, so that everyone can enjoy the peace of mind of not having to worry about the death of the dollar…
Read them at “Unpaywalled: Two posts about de-dollarization,” from @Noahpinion.
Then contemplate this analysis (by economists at the Federal Reserve Bank of New York) of the consequences of that continuity…
The importance of the U.S. dollar in the context of the international monetary system has been examined and studied extensively. In this post, we argue that the dollar is not only the dominant global currency but also a key variable affecting global economic conditions. We describe the mechanism through which the dollar acts as a procyclical force, generating what we dub the “Dollar’s Imperial Circle,” where swings in the dollar govern global macro developments…
Worth reading in full and pondering: “The Dollar’s Imperial Circle,” from @LibertyStEcon (a newsletter of @NewYorkFed).
* Washington Irving
###
As we contemplate currency, we might spare a thought for Leonid Kantorovich; he died on this date in 1986. An economist and mathematician best known for his theory and development of techniques for the optimal allocation of resources, he is regarded as the founder of linear programming— for which he received the Nobel Memorial Prize in Economic Sciences in 1975.

“The whole of the global economy is based on supplying the cravings of two percent of the world’s population”*…

Perhaps that’s an oversimplification; but as a new McKinsey Global Institute study suggests, perhaps not by much…
We have borrowed a page from the corporate world—namely, the balance sheet—to take stock of the underlying health and resilience of the global economy as it begins to rebound from the COVID-19 pandemic. This view from the balance sheet complements more typical approaches based on GDP, capital investment levels, and other measures of economic flows that reflect changes in economic value… [and] provides an in-depth look at the global economy after two decades of financial turbulence and more than ten years of heavy central bank intervention, punctuated by the pandemic.
Across ten countries that account for about 60 percent of global GDP—Australia, Canada, China, France, Germany, Japan, Mexico, Sweden, the United Kingdom, and the United States—the historic link between the growth of net worth and the growth of GDP no longer holds. While economic growth has been tepid over the past two decades in advanced economies, balance sheets and net worth that have long tracked it have tripled in size. This divergence emerged as asset prices rose—but not as a result of 21st-century trends like the growing digitization of the economy.
Rather, in an economy increasingly propelled by intangible assets like software and other intellectual property, a glut of savings has struggled to find investments offering sufficient economic returns and lasting value to investors. These savings have found their way instead into real estate, which in 2020 accounted for two-thirds of net worth. Other fixed assets that can drive economic growth made up only about 20 percent the total. Moreover, asset values are now nearly 50 percent higher than the long-run average relative to income. And for every $1 in net new investment over the past 20 years, overall liabilities have grown by almost $4, of which about $2 is debt…
“The rise and rise of the global balance sheet: How productively are we using our wealth?,” from @McKinsey_MGI
(Image above: source)
* Bill Bryson
###
As we recalculate: we might spare a thought for composer, musician, director, and producer Frank “anything played wrong twice in a row is the beginning of an arrangement” Zappa; he died (of pancreatic cancer) on this date in 1993 at age 52.
“Politics is the entertainment branch of industry”
“The bottom line is always money”

“Symmetry is not the way of the world in all times and places”*…
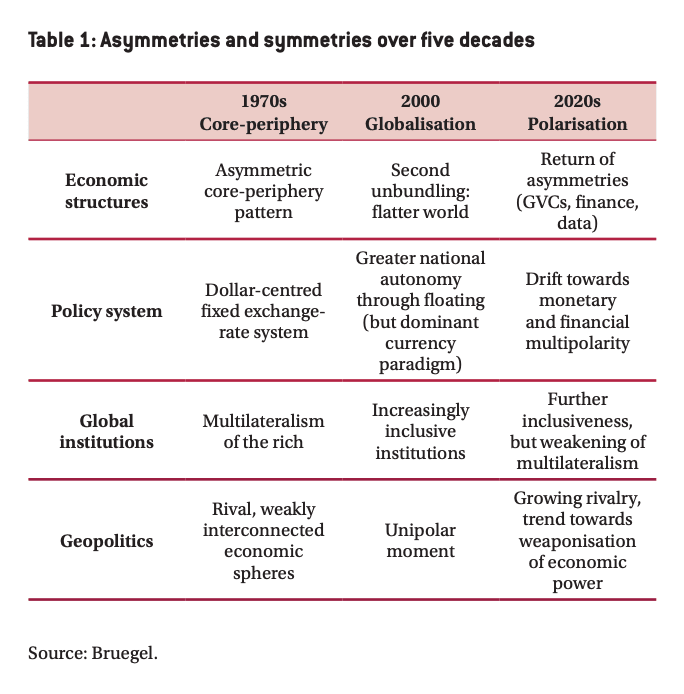
What a difference a couple of decades make…
Asymmetries are back. Rising market power, the sudden ubiquity of global digital networks, hierarchical hub-and-spoke structures in international trade and finance and the enduring dominance of the US dollar, despite the transition to floating exchange rates, all point to their resurgence. The remarkable decay of economic multilateralism in the very fields – trade and development finance – where global rules and institutions were first tried and reigned supreme for decades, is paving the way to a redefinition of international relations on a bilateral or regional basis, with powerful countries setting their own rules of the game. This transformation is compounded by the strengthening of geopolitical rivalry between the US, China and a handful of second-tier powers.
Donald Trump’s attempt to leverage US centrality in the global economy to extract rents from economic partners was short-lived. But US policy has certainly changed permanently. For all its friendly intentions, the Biden administration leaves no doubt about its overriding priorities: a foreign policy for the (domestic) middle class – to quote the title of a recent report (Ahmed et al, 2020) – and the preservation of the US edge over China. China, for its part, has set itself the goal of becoming by 2049 a “fully developed, rich and power-ful” nation and does not show any intention to play by multi-lateral rules that were conceived by others. In this context, the rapid escalation of great power competition between Washington and Beijing is driving both rivals towards the building of competing systems of bilateral or regional arrangements.
What is emerging is not only an asymmetric hub-and-spoke landscape. It is a world in which hubs are controlled by major geopolitical powers – in other words, a multipolar, fragmented world. Nothing indicates that these asymmetries will fade away any time soon. On the contrary, economic, systemic and geopolitical factors all suggest they may prove persistent. We will have to learn to live with them.
There are several consequences. First, this new context calls for an analytical reassessment. Recent research has put the spotlight on a series of economic, financial or monetary asymmetries and has begun to uncover their determinants and effects. Analytical and empirical tools are available that make it possible to gather systematic evidence and to document the impact of asymmetries on the distribution of the gains from economic interdependence. We are on our way to learning more about the welfare and the policy implications of participating in an increasingly asymmetric global system.
Second, the relationship between economics and geopolitics must now be looked at in a more systematic way. For many years – even before the demise of the Soviet Union – international economic relations were considered in isolation, at least by economists. They were looked at as if they were (mostly) immune from geopolitical tensions. This stance is no longer tenable, at a time when great-power rivalry is reasserting itself as a key determinant of policy decisions. Whatever their wishes, economists have no choice but to respond to this new reality. They should document the potential for coercion by powers in control of crucial nodes or infrastructures and the risks involved in participating in the global economy from a vulnerable position.
Third, supporters of multilateralism need to wake up to the new context. They have too often championed a world made up of peaceful and balanced relations that bears limited resemblance to reality. Because power and asymmetry can only be forgotten at one’s own risk, neglecting them inevitably fuels mistrust of principles, rules and institutions that are perceived as biased. Multilateralism remains essential, but institutions are not immune to the risk of capture.
Asymmetry, however, does not imply a change of paradigm. Even if it affects the distribution of gains from trade, it does not abolish them. And in a world in which global public goods (and bads) have moved to the forefront of the policy agenda, there is no alternative to cooperation and institutionalised collective action. The prevention of climate-related disasters, maintenance of public health and preservation of biodiversity will remain vital tasks whatever the state of inter-national relations. What asymmetries call for is an adaptation of policy template. The multilateral project should not be ditched, but it must be rooted in reality.
Understanding the emerging new global economy: from the conclusion of Jean Pisani-Ferry‘s (@pisaniferry) paper, “Global Assymetries Strike Back,” eminently worth reading in full. [Via @adam_tooze]
* Charles Kindelberger, economic historian and architect of the Marshall Plan
###
As we find our place, we might send tight birthday greetings to Paul Adolph Volcker Jr.; he was born on this date in 1927. An economist, he was appointed Federal Reserve Chair by President Carter in 1979, and reappointed by President Reagan. He took that office in a time of “stagflation” in the U.S.; his tight money policies, combined with Reagan’s expansive fiscal policy(large tax cuts and a major increase in military spending), tamed inflation, but led to much larger federal deficits (and thus, higher federal interest costs) and increased economic imbalances across the economy. In the end, Reagan let Volcker go; as Joseph Stiglitz observed, “Paul Volcker… known for keeping inflation under control, was fired because the Reagan administration didn’t believe he was an adequate de-regulator.”
Volcker returned to government service in 2009 as the chairman of President Obama’s Economic Recovery Advisory Board. In 2010, Obama proposed bank regulations which he dubbed “The Volcker Rule,” which would prevent commercial banks from owning and investing in hedge funds and private equity, and limit the trading they do for their own accounts (a reprise of a key element in the then-defunct Glass-Steagell Act). It was enacted; but in 2020, FDIC officials said the agency would loosen the restrictions of the Volcker Rule, allowing banks to more easily make large investments into venture capital and similar funds.

“There’s nothing in the world so demoralizing as money”*…

The beginning of a MUCH longer infographic
This infographic was initially created to show how much money exists in its different forms. For example, to highlight how much physical cash there is in comparison to broader measures of money which include saving and checking account deposits.
Interestingly, what is considered “money” depends on who you are asking.
Are the abstractions created by Central Banks really money? What about gold, bitcoins, or other hard assets?
Since we first released this infographic in 2015, “All the World’s Money and Markets” has taken on a different meaning to us and many others. It’s a way of simplifying a complex universe of currencies, assets, and other financial instruments in a way that people can understand.
Numbers represented in the data visualization range from the size of the above-ground silver market ($17 billion) to the notional value of all derivatives ($1.2 quadrillion as a high-end estimate). In between those two extremes, we’ve added many other familiar measures, such as the GDP of California, the value of equities, the real estate market, along with different money supply metrics to give perspective…
See the infographic in its entirety– and ponder such take-aways as that the total of all derivatives outstanding today exceeds the total before the crash of 2008 the led to the Great Recession— at “All of the World’s Money and Markets in One Visualization.”
* Sophocles, Antigone
###
As we batten down the hatches, we might send careful-calculated birthday greetings to Amartya Kumar Sen; he was born on this date in 1933. A polymathic economist and philosopher, he has made material contributions to welfare economics, social choice theory, thinking on economic and social justice, economic theories of famines, and indices of the measure of well-being of citizens of developing countries.
Sen’s revolutionary contribution to development economics and social indicators is the concept of “capability” developed in his article “Equality of What”. He argues that governments should be measured against the concrete capabilities of their citizens. This is because top-down development will always trump human rights as long as the definition of terms remains in doubt (is a “right” something that must be provided or something that simply cannot be taken away?). For instance, in the United States citizens have a hypothetical “right” to vote. To Sen, this concept is fairly empty. In order for citizens to have a capacity to vote, they first must have “functionings”. These “functionings” can range from the very broad, such as the availability of education, to the very specific, such as transportation to the polls. Only when such barriers are removed can the citizen truly be said to act out of personal choice. It is up to the individual society to make the list of minimum capabilities guaranteed by that society. For an example of the “capabilities approach” in practice, see Martha Nussbaum‘s Women and Human Development. [source]
Called the “conscience of his profession,” Sen was awarded the Nobel Memorial Prize in Economic Sciences in 1998; India’s Bharat Ratna in 1999 for his work in welfare economics; and in 2017, the Johan Skytte Prize in Political Science.

You must be logged in to post a comment.