Posts Tagged ‘Etch A Sketch’
“Everything is in motion. Everything flows.”*…
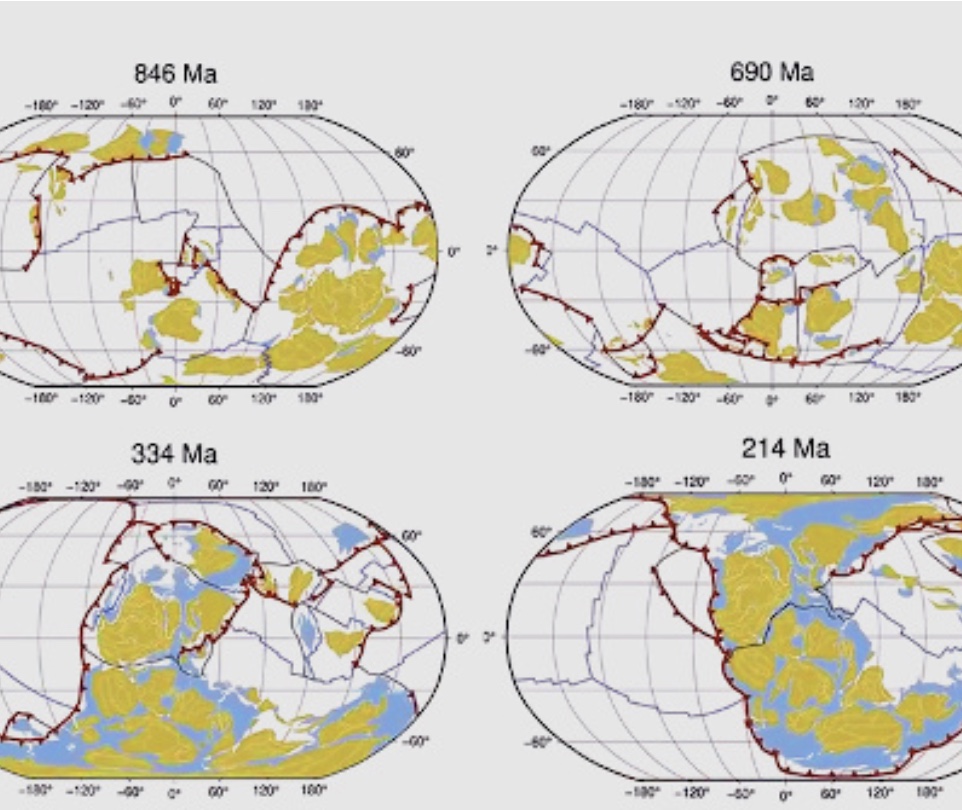
(Roughly) Daily has looked at the related theories of plate tectonics and continental drift before (e.g., here and here). They are relatively young: proposed in the early twentieth century by Alfred Wegener, they weren’t widely accepted until 1960 or so. Now they’re fundamental– and allowing scientists to reconstruct the earth’s past. To wit, this animation looking at the Earth’s tectonic plate movement from 1 ga (geological time for 1 billion years ago) to the present-day (the video starts at time 1,000 ma [1,000 million years ago], and moves at the rate of about 25 million years every second)…
Here’s a even more ambitious project, looking back 3.3 billion years:
More on plate tectonics and the supercontinents that it formed (and unformed) at Visual Capitalist.
* William Hazlitt
###
As we buckle up, we might recall that in the very late 50s, the Ohio Art Company– which had been pursuing a pair of business: toys (e.g., windmills and a climbing monkey) and custom metal lithography products for food container and specialty premium markets– found a way to merge the two. It acquired the rights to French electrician André Cassagnes‘ L’Écran Magique (The Magic Screen)– a drawing toy that allowed users to spin knobs to create line drawings, which could be erased by by turning the device upside down and shaking it. Ohio Art renamed it the Etch A Sketch, and introduced it in this date in 1960.
At its launch, which was near the peak of the Baby Boom, the Etch A Sketch was priced at $2.99 (equivalent to $26 in 2020); the company sold 600,000 units that year … and went on to sell over 100 million units and to earn a place in the National Toy Hall of Fame.

“There is a magic in graphs”*…

Joseph Priestley 1769, London
illustrates the succession of empires to give students a more global view of history across space and time. Vertical space indicates each empire’s significance, as assigned by Priestley. Click here for zoomable version
Data visualization leapt from its Enlightenment origins and into the minds of the general public in the 1760s. It cast more powerful spells throughout the following century. By 1900, modern science, technology, and social movements had all benefited from this new quantitative art. Its inventions include the timeline, bar chart, and thematic map. Together, these innovations changed how we understand the world and our place within it. Data visualization helped a new imagination emerge, wired to navigate a reality much bigger than any single person’s lived experience…
From the introduction to Stanford Library’s (more specifically, the David Rumsey Map Center‘s; @DavidRumseyMaps) glorious exhibition “Data Visualization and the Modern Imagination,” curated by R.J. Andrews (@infowetrust).
Visit the exhibition here.
* Henry D. Hubbard, in the preface to Graphic Presentation
###
As we show and tell, we might recall that it was on this date in 1908 that Henry Winzeler founded the Ohio Art Company. Ohio Art began by offering metal picture frames, but soon settled into into two lines of business: toys (e.g., windmills and a climbing monkey) and custom metal lithography products for food container and specialty premium markets.
Those two themes merged in the very late 1950s, when Ohio Art acquired the rights to French electrician André Cassagnes‘ L’Écran Magique (The Magic Screen)– a drawing toy that allowed users to spin knobs to create line drawings, which could be erased by by turning the device upside down and shaking it. Ohio Art renamed it the Etch A Sketch… and it went on to sell over 100 million units and to earn a place in the National Toy Hall of Fame.
You must be logged in to post a comment.