Posts Tagged ‘infographics’
There but for the grace of God…

This (thankfully unexecuted) 1948 plan for traffic flow in San Francisco is one of the many fascinating specimens on Andrew Lynch’s Tumblr Hyperreal Cartography & The Unrealized City— city planning maps collected from libraries, municipal archives, and dark corners of the internet, all memorializing metropolitan visions never actually instantiated.
[via MapLab; for a higher resolution version of the image above, which is courtesy of WalkingSF, click here]
###
As we program our GPS units, we might recall that it was on this date in 1974 that Paper Lace’s “The Night Chicago Died” hit #1 on the Billboard Hot 100 chart. The tuneful tale of a (fictional) shoot-out between gangsters tied to Al Capone and the Chicago Police, the single was a follow-up to “Billy Don’t Be a Hero,” a #1 hit in the U.K. for Paper Lace (which wrote the song), but virtually unheard in the U.S. where Bo Donaldson and the Heywoods’ cover scooped the Paper Lace release, and reached #1.

“Without music, life would be a mistake”*…
From great songs…

… to the works of great bands…
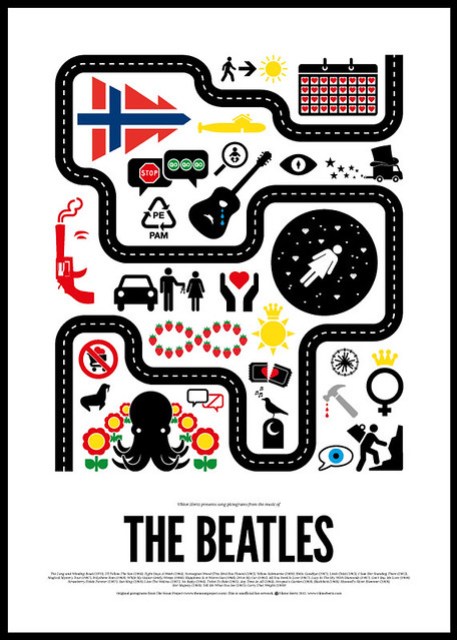
… Designer Viktor Hertz presents The Pictograms of Pop (among many other graphic delights).
* Friedrich Nietzsche
###
As we smile semiotically, we might recall that it was on this date in 1957 that rock and roll’s first great wild man, “The Killer”– Jerry Lee Lewis– appeared on television for the first time.
 click here or on the image above to view JLL’s July 28, 1957 appearance on The Steve Allen Show
Bringing the war home…

In September of 1939, Americans were reading of the outbreak of war. Nazi Germany invaded Poland, thus ending any pretense that Hitler’s goal was ‘peace in our time.’ Poland’s main allies, Britain and France, promptly declared war on Germany. And though the Nazi’s only avowed goal at the time was winning the Polish campaign, the phrase ‘Second World War’ was first widely used.
The U.S. at the time was swathed in a peaceful cocoon; newspaper editors and the wire services that supplied them struggled to find ways to communicate what was unfolding abroad– a challenge colored by each paper’s politics. The Isolationist-Interventionist debate in the U.S. was reaching a boil. Some papers encouraged their readers appreciate the enormity of the events in Europe; others did their best to minimize them…
The map above, created by Newspaper Enterprise Association (NEA, as in the bottom right of the image), a syndication service specializing in both images (comics and pictures) and features, was delivered to over 700 newspapers across the country. Its caption read:
All this talk about history-making battles waged, armies on the march and territory taken sounds big in the day’s war news, but how small it is in American terms may be seen from the map above. Shifted to the American scene, European armies might fight their battles on the Maginot-Siegfried lines in the center of Illinois. This would put London about where Minneapolis is, Paris at Des Moines, Berlin at Toledo, Warsaw at Washington.
Read the whole story at Strange Maps‘ “All Quiet on the Illinois Front.”
###
As we ponder proximity, we might recall that it was on this date in 1943 that Joseph Stalin, Premier of the Soviet Union, issued Order No. 227– what came to be known as the “Not one step backward” order– in response to German advances into Russian territory. It declared: “Panic makers and cowards must be liquidated on the spot. Not one step backward without orders from higher headquarters! Commanders…who abandon a position without an order from higher headquarters are traitors to the Fatherland.”

1945 Soviet postage stamp with the famous phrase “Not One Step Backwards”.
“A popular government without popular information or the means of acquiring it, is but a prologue to a farce, or a tragedy, or perhaps both”*…

The U.S. Census has long been a lightning rod for controversy. Does it wildly undercount minorities? Wildly overcount minorities? Or—as Michelle Bachmann warned us—is it a liberal plot orchestrated by ACORN?
But no one has ever accused our Census Bureau of being a hotbed of…graphic design. Until now.
A Handsome Atlas celebrates Uncle Sam’s data chops by reproducing three Statistical Atlases from the latter decades of the 19th century…
It’s the work of Jonathan Soma, cofounder of the Brooklyn Brainery and stat freak (tracker of everything from Tokyo breakfast habits to bike lanes)… and it’s fascinating.
… you can follow the decline of Charleston, South Carolina, after the Civil War and the sudden ascendency of Milwaukee following the arrival of Miller, Pabst, Schlitz, and Blatz.
Curious footnotes in American history pop up everywhere, as Soma discovered when he spotted an apparent flaw in a U.S. map. “Where Oklahoma should be, we had I.T.,” he says. “It turns out it was Indian Territory. In 1905 the Native Americans who lived there applied for statehood. They wanted to create something called the State of Sequoia. But they were shot down, and two years later Oklahoma was made.”
Together the Atlases show a country emerging from crisis to redefine itself: more urban, diverse, and if you lived in Illinois or Kentucky, substantially more wasted [as illustrated in the chart above]…

The first Statistical Atlas of the United States of America was published in 1874 to coincide with the nation’s centennial. Two of the most stunning Atlases, from 1880 and 1890, were produced by Henry Gannett, who went on to co-found the National Geographic Society. His final Atlas even contains intimations of the Information Age. The 1890 census was the first to use a punch-card tabulating machine devised by Henry Hollerith, whose company would form the foundation of IBM…
In one regard the census has changed dramatically. While the 2000 Census broke down race into 63 categories, a century earlier we came in only five “colors.” The language of these Atlases oozes xenophobia. Maps and charts refer to “natives” and “non-natives.” Non–European Americans are lumped in as “other foreign.” And slave populations are often omitted altogether.
Then there are the “deaf mutes, paupers, and prisoners,” gathered under the heading: “Defective, Dependent, and Delinquent Classes.” Or this antiquated guide to the “insane” of 1870. I mean, who would be insensitive enough to call for a national database of the mentally ill these days?

Read the whole colorful story in Jeffrey Rotter‘s “The Motley Roots of Data Visualization in 19th Century Census Charts.”
* James Madison
###
As we regret that we haven’t got more fingers and toes, we might recall that it was on this date in 1789 that George Washington became the first and only president to be unanimously elected by the Electoral College, a feat he repeated on the same date in 1792.
Washington’s overwhelming popularity made for a relatively smooth kick-off for the Republic. Still, the electoral system soon began to cause problems. History.com explains:
The peculiarities of early American voting procedure meant that although Washington won unanimous election, he still had a runner-up, John Adams, who served as vice president during both of Washington’s terms. Electors in what is now called the Electoral College named two choices for president. They each cast two ballots without noting a distinction between their choice for president and vice president. Washington was chosen by all of the electors and therefore is considered to have been unanimously elected. Of those also named on the electors’ ballots, Adams had the most votes and became vice president.
Although Washington’s overwhelming popularity prevented problems in 1789 and 1792, this procedure caused great difficulty in the elections of 1796 and 1800. In 1796, Federalist supporters of John Adams cast only one of their two votes in an effort to ensure that Adams would win the presidency without giving votes to any of the other candidates. This led to a situation in which the Federalist Adams won the highest number of votes and became president, but Thomas Jefferson, the opposing Democratic-Republican candidate, came in second and therefore became his opponent’s vice president.
In 1800, the system led to a tie between the Democratic-Republican candidates for president and vice president, Thomas Jefferson and Aaron Burr. This sent the vote to the House of Representatives, where Federalists voted for Burr instead of Jefferson, whom they despised. As a result, the Congressional vote ended in a tie 35 times before the Federalists decided to hand in blank ballots and concede the White House to Jefferson.
In 1804, the 12th Amendment to the Constitution ended this particular form of electoral chaos by stipulating that separate votes be cast for president and vice president.

Time Capsule…

Isotype, the visual language pioneered by Austrian sociologist, philosopher and curator Otto Neurath and his wife Marie in the 1930s, shaped modern infographics and visual storytelling.
America and Britain: Three Volumes in One, also known as Only an Ocean Between, is a wonderful 1946 out-of-print book by P. Sargant Florence and Lella Secor Florence from the golden age of ISOTYPE, kindly digitized by Michael Stoll, presenting a series of minimalist infographics that compare and contrast various aspects of life in Britain and the United States…
As a time-capsule of cultural change and technological progress, the infographics put present-day numbers in perspective, especially in the domains of telecommunication, media, and resource usage.

Read more at Brain Pickings; and see more of the extraordinary graphics (in the size of one’s choice) at Michael Stoll’s Flickr stream.
###
As we contemplate our “cousins,” we might send judicious birthday greetings to James Delancey; he was born on this date in 1703. A Cambridge-educated English aristocrat, Delancey migrated to the American colonies, settling in Manhattan, where he was appointed Chief Justice by Royal Governor William Cosby.
The times were tense: Eighteenth century American colonists were demanding increased freedom and democracy; many colonial New Yorkers were individualistic entrepreneurs seeking financial success and independence, unwilling quietly to defer to what they viewed as antiquated claims of royal privilege. Proponents of royal rule– including Delancey and Cosby– desperately sought to maintain power in the face of that growing opposition.
Peter Zenger’s New York Weekly Journal, a paper regularly critical of royal privilege, published articles in the early 1730s exposing Governor Cosby’s unjust policies, backroom financial deals, and bullying tactics. A furious Cosby condemned the Journal, had copies of the paper publicly burned, and– to widespread public outrage– imprisoned Zenger for eight months while he awaited trial for seditious libel.
At the trial in 1735– presided over by a decidedly-hostile Delancey– Zenger’s lawyer, Andrew Hamilton (like Zenger a former indentured servant turned successful businessman), aimed his defense at the jury rather than the judge, hoping that a public fearful of royal abuses would condemn Cosby and protect Zenger. Hamilton conceded that Zenger had published articles critical of Cosby but eloquently argued that because the articles contained truths in the form of statements of verifiable facts, they could not be libelous. The jury’s “not guilty” verdict generated spontaneous cheers from the gallery… More importantly the verdict, which created the precedent that truth is a defense against charges of libel, laid the foundation for American press freedom.
As Founding Father Gouverneur Morris said, “The trial of Zenger in 1735 was the germ of American freedom, the morning star of that liberty which subsequently revolutionized America.”
(More on the trial, its protagonists, and its impact here.)

The burning of Zenger’s New York Weekly Journal (Bettman Archive)
You must be logged in to post a comment.